Lightweight BI system for university, part I
Executive summary
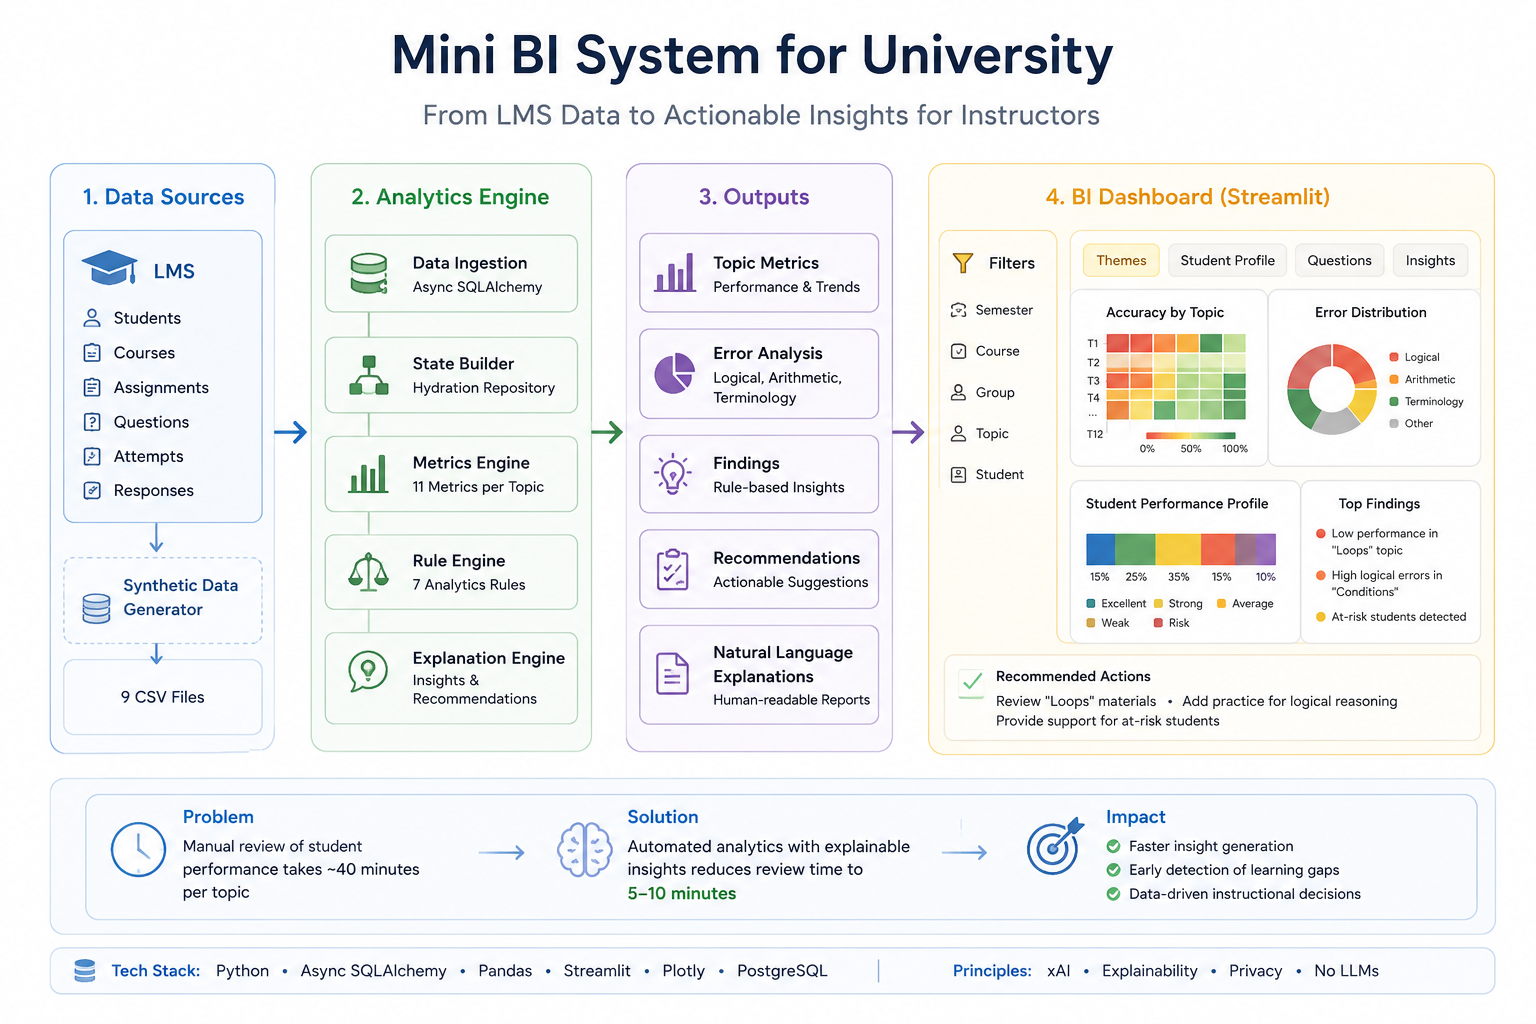
This project demonstrates the development of a lightweight Business Intelligence system for a university Learning Management System (LMS), designed to help instructors identify learning patterns, detect at-risk students, and reduce the time required to review student performance.
The primary objective is to decrease manual analysis of a student group from approximately 40 minutes to 5–10 minutes by providing explainable analytics instead of relying on black-box AI models. Because the customer prohibits the use of Large Language Models (LLMs) for educational decision-making, the solution follows Explainable AI (xAI) principles, where every recommendation is accompanied by evidence, alternative interpretations, confidence levels, and known limitations.
The project was implemented under several practical constraints, including limited development time, restricted access to the production LMS, and strict personal data protection requirements. To overcome these limitations, a synthetic data generator was developed to reproduce the structure and statistical characteristics of the real LMS database while avoiding the use of sensitive student information.
The resulting system consists of four major components:
- a synthetic LMS data generator for development and testing;
- an incremental analytics engine that processes only changed data instead of recomputing the entire dataset;
- an explainable rule-based analytics pipeline that transforms raw LMS events into actionable educational insights;
- an interactive Streamlit dashboard for visual exploration of student performance, engagement, risks, and recommendations.
Unlike traditional BI dashboards that primarily display aggregated metrics, the system focuses on decision support. It combines quantitative indicators with structured explanations, helping instructors understand not only what happened, but also why, how confident the system is, and which interventions should be considered.
The current prototype processes synthetic datasets representing a single faculty for period of one year and was designed with asynchronous architecture and incremental data processing for future scaling.
Although the current implementation covers only part of the requested functionality, it establishes a modular architecture that can be extended with additional analytical models, visualization capabilities, and educational recommendations without fundamental redesign. The fundamental objective is to support user in his\her decision making.
About the customer
My current customer is a group of university professors and lectors whose initiative is to apply the power of AI to simplify their work.
The idea is to help them to analyze the data from their LMS - reduce time on group's work review from 40 minutes to 5 - 10 minutes.
Currently, the customer uses LMS system to manage the students' work and grades. The LMS provides dashboards with basic analytical data. Review of such work takes time and could potentially reduced by applying AI and BI tools.
LLM usage is prohibited there, the results should be explainable, therefore principles of xAI should be used here.
System should be able to:
- visualize of the distribution of responses by chapters, topics and questions
- identifies topics with low (<50%) and high (>80%) performance
- classifies error types
- generates natural language output with specific recommendations
- show total scores and trends
- show completion time, attempts, deadlines
- show task difficulty thresholds
- show attendance and activity
- comparison of different metrics (performance ↔ time ↔ attempts)
- identification of tasks that no one has solved/that everyone has solved
- generating recommendations (simplify/complicate)
- automatic report on at-risk students
- personalized recommendations on topics and tasks
- a summary report on the risk group with rationale
- recommendations for interventions (what to repeat, who to focus on)
Discovery
Despite on new business domain and technology discovery phase has been concisely skipped or better to say scattered among the whole project.
Limited budget and tight schedule push me and customer to agreed on R&D form ow work when results are not strictly aligned to time constraints in the favor of maximum project's velocity.
Ethical constraints and system limitations
As the engineer designing this system, I have to assume that users will rely on its outputs when making real-world decisions. In practice, this means they delegate part of their cognitive work to the system. If the analytical process is flawed or the conclusions are misleading, the resulting harm extends far beyond a single incorrect prediction.
There is currently no algorithm capable of modelling the full complexity of the real world. Every analytical model is necessarily incomplete and operates under assumptions and uncertainty. Consequently, fully autonomous machine analytics cannot be considered universally correct by design. An important responsibility of the system is therefore to make its own limitations visible rather than creating an illusion of certainty.
Based on these principles, the reporting model was designed together with a Large Language Model (LLM) to support human reasoning rather than replace it. The objective is not to generate authoritative answers but to provide transparent, evidence-based analytical assistance. This design philosophy is consistent with the direction taken by several state-of-the-art analytical platforms while introducing explicit mechanisms for uncertainty and alternative explanations.
| Design principle | Typical LLM assistants (ChatGPT, Copilot, Gemini, Claude) |
Enterprise decision-support systems (e.g. Palantir AIP) |
Proposed architecture |
|---|---|---|---|
| Separate observations from conclusions | Partially | Yes | Explicitly enforced |
| Evidence supporting every conclusion | Available when sources exist | Yes | Mandatory (Finding → Evidence) |
| Explain reasoning | Partial | Strong | Integrated into every insight |
| Represent uncertainty explicitly | Limited | Partial | Dedicated uncertainty model |
| Consider alternative explanations | Occasional | Supported | Mandatory section of every report |
| Separate recommendations from observations | Usually mixed | Generally separated | Architecturally separated |
| Auditability and traceability | Limited | High | Designed as a core capability |
| Human remains the final decision maker | Yes | Yes | Explicit design principle |
The proposed architecture intentionally follows an evidence-first approach instead of a traditional LLM-first workflow. Rather than allowing the language model to generate conclusions directly from raw data, the system first derives measurable indicators, produces findings supported by evidence, estimates confidence, records alternative explanations, and only then formulates recommendations. This preserves transparency, improves auditability, and ensures that responsibility for the final decision always remains with the human expert.
Solution
Existing LMS data model
Before to start the development of the BI system, I have to understand the existing LMS data model.
Time budget for this project is quite limited and I have been using LLM to speed up my work here. It is quite risky, because instead of working directly with LMS I use a mediator which almost always lead to distortion of information. Moreover LLMs are known for making mistakes, therefore such mistakes *might* go into the system.
Limited time and restrict direct access to organization's LMS system makes LLMs usage here as a reasonable choice.

Actual data under GDRP like policy
Russia has its own analog of GDRP like policy to secure personal data of its citizens. Right on the private life and privacy of the personal information is a fundamental constitutional right. Violation of this is strictly prohibited.
The form of my current contract allows to send me this data, but personal circumstances will result to the actual data breach without any malicious intentions from my side. In such situation, I usually inform my customer about this risks by email before to go forward.
This issue and general bureaucracy of the current organization makes me use a workaround with synthetic data model to simulate the actual data.
Synthetic data model as a workaround
To address data protection constraints and enable rapid development, I implemented a synthetic data generator that mimics the structure and statistical properties of real LMS data.
Generator architecture:
- Built with Python using Pandas, NumPy, and Pydantic for data validation
- Configurable random seed (42) ensures reproducible results
- Generates 9 interconnected tables matching the LMS data model
Student profiles:
Five student categories with distinct academic characteristics:
- Excellent (15%): mean 97, σ=2.0 — minimal attempts, near-perfect scores
- Strong (25%): mean 86, σ=5.0 — rare 2nd attempts
- Average (35%): mean 68, σ=9.5 — 1-3 attempts
- Weak (15%): mean 48, σ=11.5 — up to 4 attempts
- Risk (10%): mean 28, σ=13.5 — low engagement, high variance
Data generation logic:
- 12 topics in Economics with difficulty coefficients (0.10-0.87) and target means (37-94)
- 24 assignments (2 per topic) with realistic due dates
- 100 students with ID format ST0001-ST0100
- Attempts: scores depend on profile, topic difficulty, and attempt number
- 10 questions per attempt with error type classification (logical, terminology, arithmetic)
- Attendance rates: 38-97% based on student profile
- Weekly activity metrics: forum posts, resource views, quiz launches
Anomaly injection:
To test outlier detection algorithms, the generator applies deliberate anomalies:
- Easy assignments → inflated scores (98/100)
- Hard assignments → deflated scores (5/100)
- Specific students: weak student scoring high on easy tasks, top student scoring low on hard tasks
- Question-level patterns: all correct for easy assignments, all incorrect for hard assignments
Output format:
9 CSV files fully compatible with the target BI dashboard, enabling immediate testing of all analytical features without exposing real student data.
Visualization layer
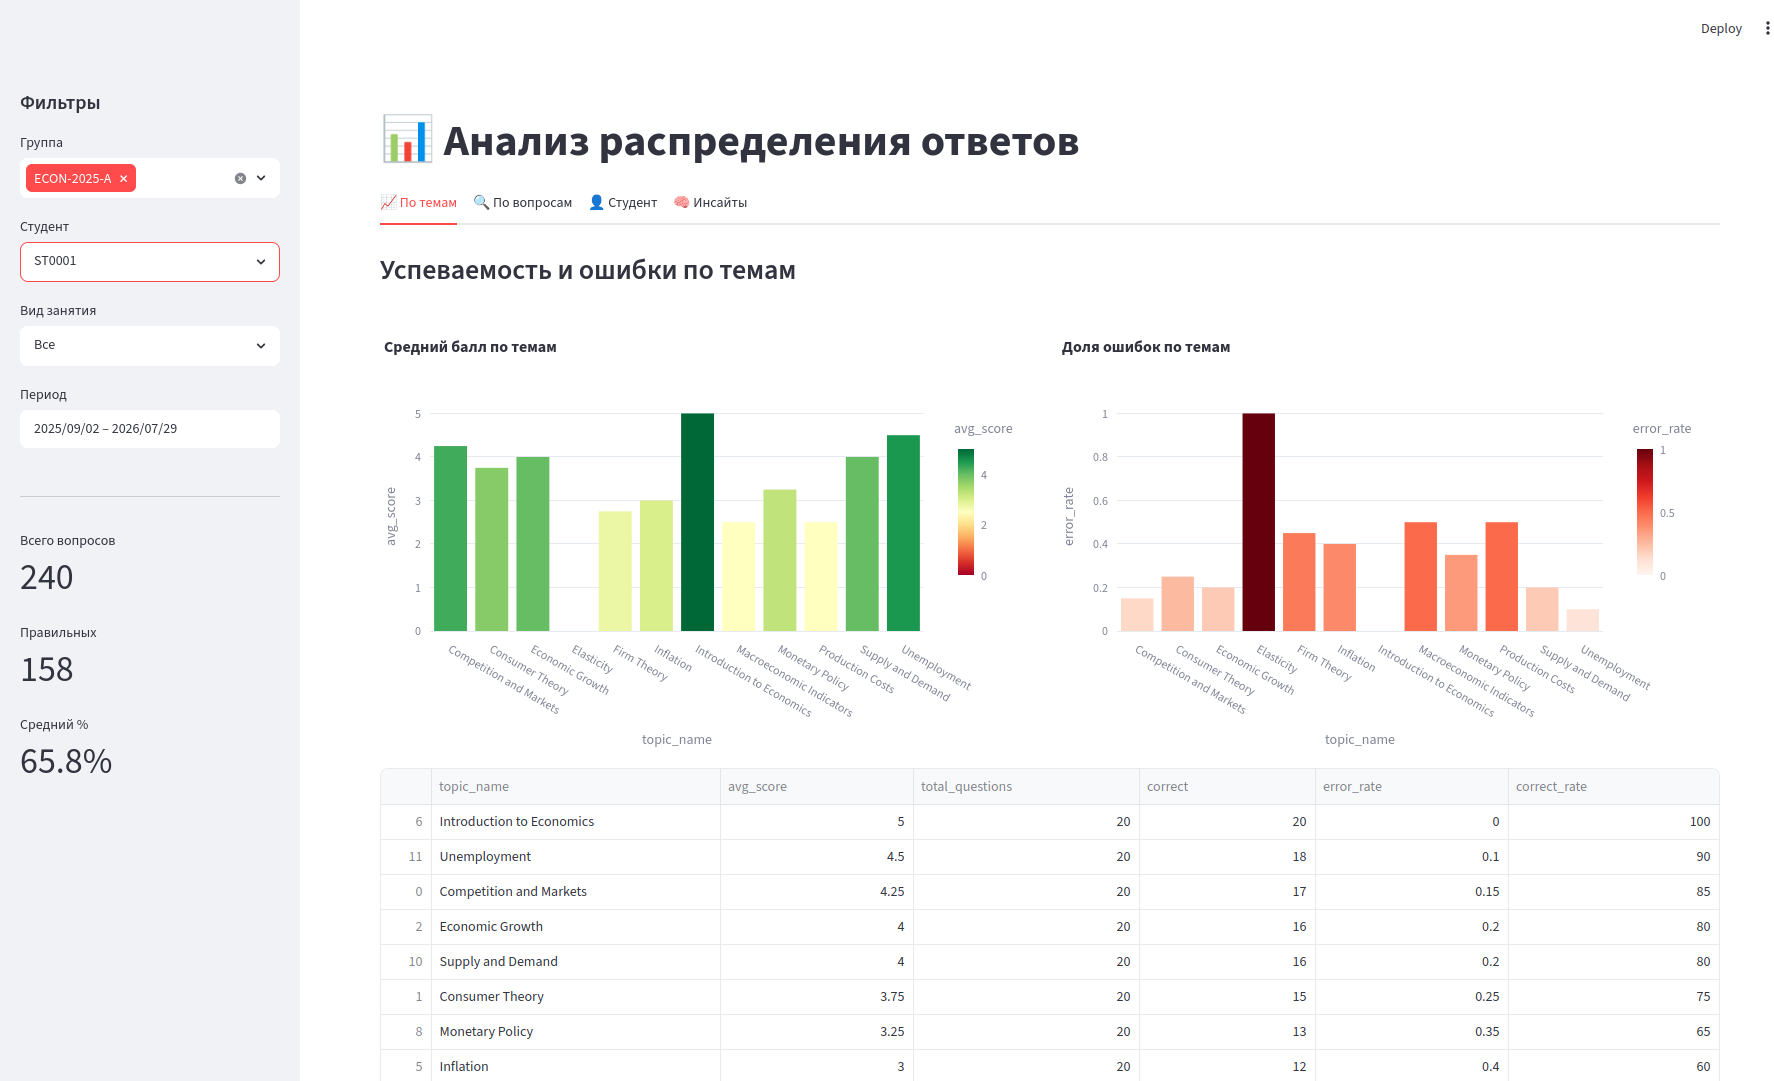
The BI system uses Streamlit as the visualization framework, providing an interactive dashboard for exploring student performance data. The visualization layer is organized into several functional tabs, each serving a specific analytical purpose.
Streamlit is chosen for its rapid development capabilities. Until this moment it has been sufficient, but further complexity of BI insights will initiate migration for more rich solutions like Tableau or others.
Technology stack:
- Streamlit — rapid UI development without frontend complexity
- Plotly — interactive charts with zoom, hover, and selection capabilities
- Pandas — data manipulation and aggregation
- Async SQLAlchemy — asynchronous database access for performance
Dashboard structure:
1. Sidebar (Global Filters)
- Group filter — select one or multiple student groups
- Student filter — individual student analysis or "All students" mode
- Assignment type filter — filter by homework, quiz, or exam types
- Date range picker — time period selection with min/max boundaries
- Quick metrics — total questions, correct answers, average success rate
2. Themes Tab
- Theme performance chart — bar chart showing average scores by topic with color gradient (red-yellow-green)
- Error distribution chart — error rates per topic with red gradient for problem areas
- Detailed table — sortable data frame with avg_score, total_questions, correct_count, correct_rate, and error_rate
3. Student Profile Tab
- Profile badge — displays student's academic category (excellent/strong/average/weak/risk)
- Performance heatmap — topic-by-topic success visualization with color coding
- Interactive bar chart — student's best performance per topic with color mapping
4. Questions Tab
- Topic selector — dropdown to choose specific topic for drill-down
- Question accuracy chart — percentage of correct answers per question (Q01-Q10)
- Smart filtering — prompts to select individual student when dataset exceeds 500 rows for performance
5. Insights Tab
- Intelligent report generation — structured findings organized by topic
- Metrics table — accuracy, difficulty, total questions, completion rate, error breakdown by type (logical, arithmetic, terminology)
- Finding cards — each finding includes:
- Hypothesis — explanatory statement about observed pattern
- Observation — formatted evidence with pattern detection (low/high accuracy)
- Evidence list — supporting metrics with automatic percentage formatting
- Alternatives — alternative explanations for the finding
- Recommendations — actionable suggestions for instructors
- Limitations — interpretation boundaries and confidence constraints
Data flow:
- Repository layer — async queries to PostgreSQL via SQLAlchemy
- Dataset builder — merges 5+ tables (students, topics, assignments, attempts, question_results) into a single denormalized DataFrame
- Filter service — applies sidebar filters to the dataset
- Analytics service — computes aggregations (theme_stats, question_stats, student_heatmap)
- Chart service — generates Plotly figures with consistent styling
- UI Presenter — formats evidence text, translates metrics to Russian, handles null values gracefully
Key design decisions:
- Separation of concerns — services handle business logic, presenters manage UI formatting
- Async architecture — non-blocking database calls for responsive UI
- Type safety — dataclasses and DTOs enforce contract between layers
- Graceful degradation — user-friendly messages when data is missing or filters yield empty results
- Russian localization — all UI labels, metrics, and findings are localized for the target audience
Performance optimizations:
- @st.cache_data — caches the base dataset to avoid repeated database queries
- Smart filtering — prompts student selection when data volume exceeds 500 rows
- Aggregated computations — pre-computed metrics in analytics database for fast retrieval
BI analytics
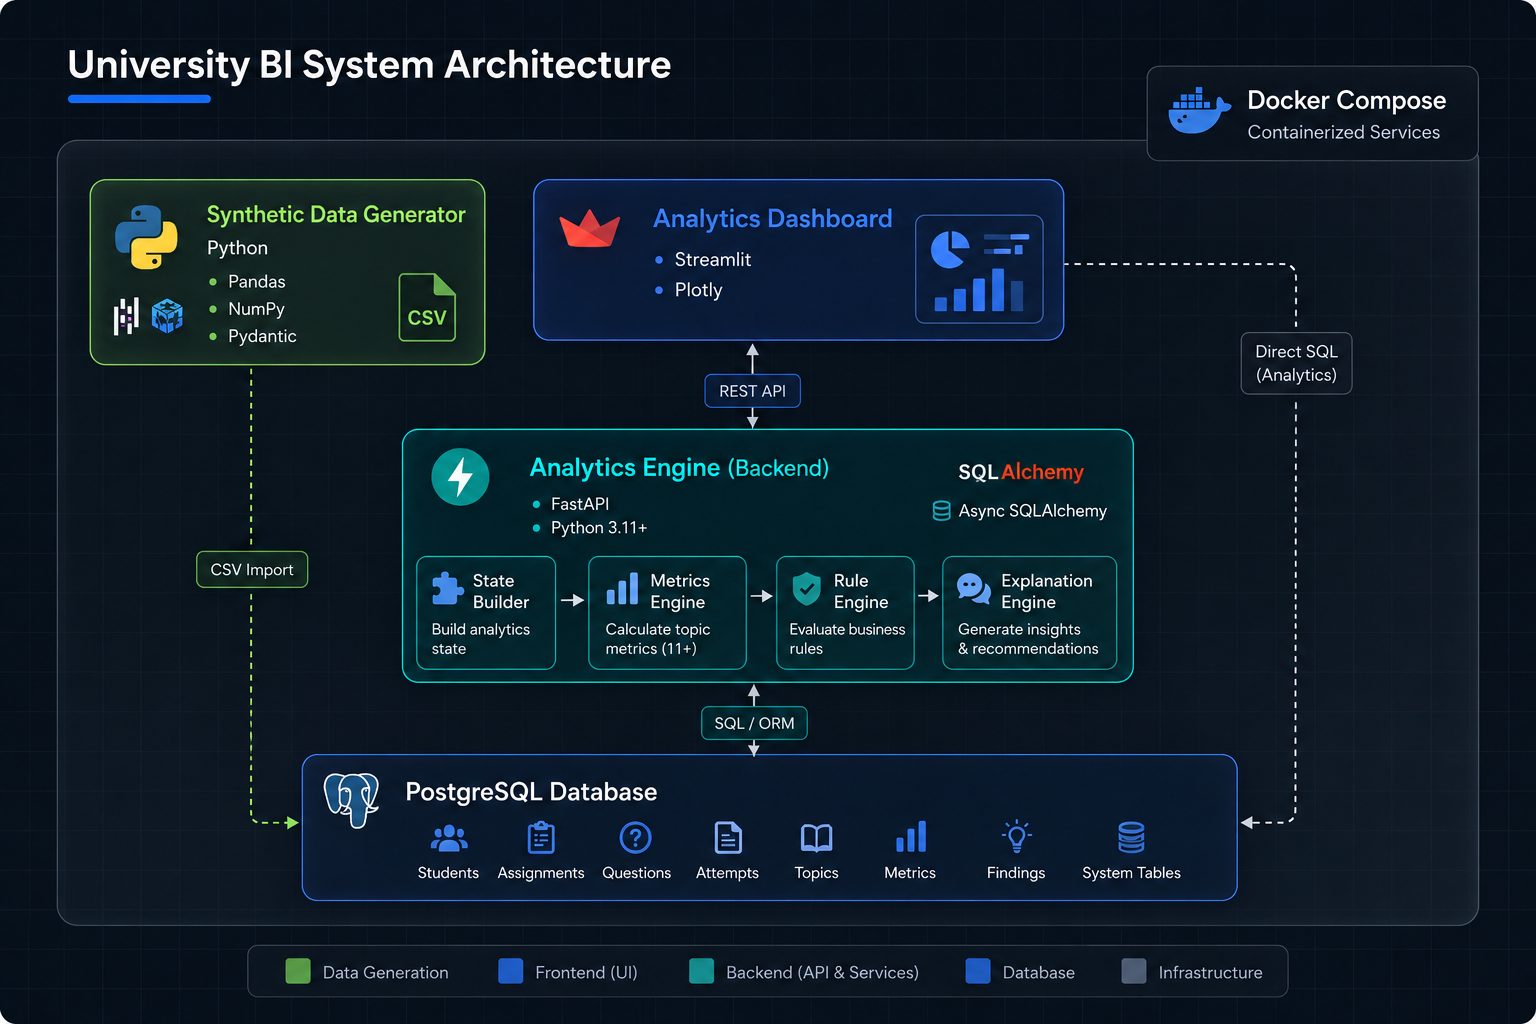
The analytics engine is an asynchronous Python application that processes LMS data through a pipeline architecture, transforming raw question results into actionable insights with explainable AI principles.
Core components:
1. Data Ingestion Layer
- Database Repository — async SQLAlchemy queries for topics, assignments, question results, and activity data
- Changes Repository — tracks unprocessed entity changes (topics, assignments, question results, students, activity) for incremental processing
- Pipeline Lock Repository — ensures only one pipeline instance runs at a time using PostgreSQL advisory locks
2. State Builder
- Hydration Repository — resolves topic IDs from changed entities (e.g., maps question_results → assignments → topics)
- Analytics State Builder — assembles a complete
AnalyticsStateobject containing all data needed for a batch (topics, assignments, question results, activity)
3. Processing Pipeline
- Metrics Engine — computes 11 metrics per topic: accuracy, error distribution (logical/arithmetic/terminology), average score, completion rate, difficulty, pressure, and engagement
- Rule Engine — evaluates 7 rules (LowAccuracy, LogicalError, ArithmeticError, TerminologyError, HighPressure, EngagementMismatch, StableHighPerformance) against each topic's metrics
- Explanation Engine — generates human-readable reports with hypotheses, severity levels, confidence scores, alternative explanations, and recommended actions
4. Persistence Layer
- Saves all results atomically in a single transaction: metrics → findings → evidence → explanations → alternative explanations → recommended actions → uncertainty notes → limitations → missing context
- Creates an
AnalyticsRunrecord to track each execution - Marks processed changes as acknowledged
Execution flow:
- Scheduler runs periodically (default: 300 seconds)
- Acquire lock — prevent concurrent runs
- Load changes — fetch unprocessed entity changes
- Build impact — resolve affected topic IDs from changes
- Hydrate state — load all data for impacted topics
- Compute metrics — aggregate question results by topic
- Apply rules — detect patterns and anomalies
- Generate explanations — create human-readable reports
- Persist results — save to database atomically
- Acknowledge changes — mark as processed
- Release lock — allow next run
Key design decisions:
- Incremental processing — processes only changed data using the
changed_entitiestable, avoiding full recomputation - Batch isolation — each batch runs in its own transaction with rollback on failure
- Separation of concerns — metrics, rules, and explanations are independent modules
- Explainable AI (xAI) — outputs are human-readable with hypotheses, evidence, alternatives, and uncertainty notes — no black-box LLMs
- Confidence scoring — each finding includes a confidence level (high/medium/low) based on rule score
- Uncertainty tracking — limitations and missing context are stored alongside each finding
Data model:
- Topics — core domain entity with difficulty and target_mean
- Assignments — linked to topics, each with type, max_score, due_date
- Question Results — per-question scores with error_type classification
- Activity Weekly — forum posts, resource views, quiz launches for engagement calculation
Output artifacts:
- topic_metrics — 11 numerical indicators per topic
- findings — detected patterns with severity and confidence
- finding_evidence — raw metrics supporting each finding
- explanations — human-readable hypotheses with confidence
- alternative_explanations — other possible interpretations
- recommended_actions — actionable suggestions for instructors
- uncertainty_notes — limitations and missing context
Docker orchestration
Each part of the BI system is packed into docker container and orchestrated by docker-compose. This allows to run the system on any machine with docker installed without any additional configuration.
Incremental analytics
The system implements an incremental batch processing approach to avoid full recomputation of analytics on every data change. Instead of recalculating all topics, it detects which entities have changed, resolves the affected topics, and recomputes only those topics.
How it works:
- Change tracking — database triggers register every INSERT/UPDATE/DELETE on source tables (topics, assignments, question_results, activity_weekly) into the
changed_entitiestable - Impact resolution — the pipeline resolves which topic IDs are affected by each changed entity (e.g., question_result → assignment → topic)
- State hydration — loads only the data needed for impacted topics
- Computation — runs metrics, rules, and explanation engines on the hydrated subset
- Acknowledgment — marks changed entities as processed after successful persistence
Comparison with industry approaches:
| Approach | Granularity | Latency | Complexity | Use case |
|---|---|---|---|---|
| Full recomputation (traditional BI) |
Entire dataset | Minutes–hours | Low | Daily batch reports |
| Stream processing (Apache Flink, Kafka Streams) |
Event-level | Milliseconds–seconds | Very high | Real-time dashboards, fraud detection |
| Lambda architecture (batch + stream layers) |
Hybrid | Mixed | High | Large-scale data platforms |
| Materialized views (PostgreSQL, ClickHouse) |
Pre-aggregated | Sub-second | Medium | Read-optimized analytics |
| Incremental batch (our system) | Topic-level (impact set) | 1–5 minutes | Medium | Educational analytics with explainable AI |
Where our approach sits:
- vs. Full recomputation — significantly faster (topics scale ~10x better), avoids redundant processing of unchanged data
- vs. Stream processing — simpler to implement and debug, no complex state management; trade-off is higher latency (minutes vs. milliseconds)
- vs. Materialized views — more flexible because we can run arbitrary Python logic (rules, explanations, uncertainty notes), not just SQL aggregations
- vs. Lambda — intentionally minimal; one batch pipeline is sufficient for the domain
Key differentiators:
- Explainability built-in — every incrementally computed finding includes hypothesis, evidence, alternatives, and confidence
- Transactional integrity — each batch runs in a database transaction; rollback on failure prevents partial results
- Deadlock safety — pipeline locks ensure only one run executes at a time
- Idempotent processing — each change is processed exactly once (
processedflag) - Auditable — every run is stored in
analytics_runswith source snapshot and status
Limitations and future improvements:
- No real-time updates — 5-minute batch interval is acceptable for education analytics but not for live dashboards
- Simple impact resolution — topic-level granularity; fine-grained (student-level or question-level) recomputation would reduce work further
- No windowing — changes accumulate; a sliding time window would allow purging old changes from the queue
- Observability — currently lacks monitoring of queue size, processing time, and failure rates
The incremental batch approach is a pragmatic choice that balances complexity, performance, and maintainability. It fits the educational analytics domain perfectly — where near-real-time insights with explainable AI are more valuable than sub-second latency.
Next steps
Only part of the requirements has been implemented. Next steps would require further extension to meet with all current requirements from stakeholders.
Related publications
Case study: ML. Housing price prediction
Case study: developing forecast sales system for a major airline
Broad vs Narrow specialisation