How many software engineers the economy could support?
Summary
This publication shares my thoughts on the question in title. As a software engineer I could not do my job if some more important duties would not be done: I need a food for a breakfast and a dinner, I need a water in my pipes, an electricity in my apartment and so on. Obviously, if I have decided to specialize in software development, someone else should do this for me. It brings us to the question how many people do we need to open a position for one software engineer? How many software engineers a single country could support at all?
With some assumptions, my conclusions are 125–150 people for one software engineer, with a limit for the country (Russia) of about 500k–700k software engineers per nation. This is roughly the current number of software engineers in Russia, and there are signals that the Russian economy needs to double (×2) this number. If we have already reached the natural limits, is it possible to achieve this goal?
Software products and digital services significantly accelerate business processes and boost performance. Software solutions are the key driver of the modern industrial revolution. That's why there has been a decades-long growing demand for experienced software engineers. However, it’s important to note that solutions created by software engineers themselves increase the overall effectiveness of the economy — and, in theory, should raise the natural limits on how many software engineers society can sustain. If so, is there a way to estimate this effect?
I asked ChatGPT to help me build a mathematical model describing this dynamic. I asked it to include several key parameters:
- Natural ratio of software engineers to population (↦ engineers per capita)
- Time to invest in developing new products (development time, T_dev)
- Time for adoption of new products into the economy (adoption delay / diffusion)
- Percent of successful product creation & adoption (success rate s)
- Economic gain that increases capacity for software engineers (feedback from gain → more engineers)
It shows these key aspects:
1️⃣ Increase Base Productivity (K₀)
Investments in real industries, automation, and IT–production synergy.
To double D solely through higher K₀, it’s necessary to nearly double (K₀ + E) — a very ambitious target.
2️⃣ Strengthen Feedback (α)
Enhance success rate (s), implementation speed (a), and infrastructure quality (α_raw).
In practice: commercialization programs, integration standards, and investments in implementation.
Even a moderate increase in α has a strong effect thanks to the denominator (1−t).
3️⃣ Increase Export (E)
More developers working for external markets, without burdening the domestic economy.
Raising E from 0.2 to 0.6 can almost double D, but it requires demand, language proficiency, and proper legal and financial conditions.
4️⃣ Reduce R
Automation, low-code platforms, and centralized DevOps solutions.
Reducing R by half (from 125 to 62) formally doubles D, though in practice it’s a slow process.
5️⃣ Combined Strategy
Moderate increase in K₀ (+20–50% over 5–10 years),
Expansion of E (to 30–40%),
Improvement of s and a (through adoption and scaling).
This approach can achieve a 2× increase without extreme α parameters.
As a post scriptum, it’s worth remembering: all models are wrong, but some are useful — because they help us see things that would otherwise remain hidden. Keep this in mind when you read this and any other model.
Basic assumptions
1. Current data (2025)
| Indicator | Estimate |
|---|---|
| Population of Russia | ≈ 146 million |
| Population aged 20–55 | ≈ 76–78 million |
| Total IT specialists | ≈ 1 million |
| Developers | ≈ 500–700 thousand |
| Developers with 5+ years experience | ≈ 250–400 thousand |
| Reported deficit | Up to 1 million IT specialists (all fields) |
2. Theoretical limit — “1 developer per 125 working-age people”
For a population of 76 million aged 20–55:
76,000,000 ÷ 125 = 608,000
That means approximately 600,000 developers represent the demographic maximum.
3. Why 1 : 125 can be considered the lower threshold of stability
At this ratio, the economy already covers its internal IT needs — digital infrastructure, public sector, banking, retail, and industry.
Increasing the share of developers beyond this level requires strong IT export capacity; otherwise, there simply isn’t enough domestic demand to employ them effectively.
Therefore, 1 : 125 represents a sustainable minimum for a developed country, but not a ceiling — it is rather the point at which internal demand becomes saturated.
4. Indirect confirmation of the upper boundary
If we take the U.S. or Israel as benchmarks and scale their ratios to Russia’s demographics:
1 : 65 → ~1.1–1.2 million developers
1 : 80 → ~950 thousand
1 : 125 → ~600 thousand
➡️ Even the most technologically advanced economies in the world rarely exceed a ratio of 1 : 50–60, while most stable ones fall between 1 : 80 and 1 : 150.
Thus, 1 : 125 is a well-supported lower bound, while the upper range likely lies around 1 : 70–100 — achievable when a country actively exports IT services or undergoes large-scale automation.
Building a model
1. Base model
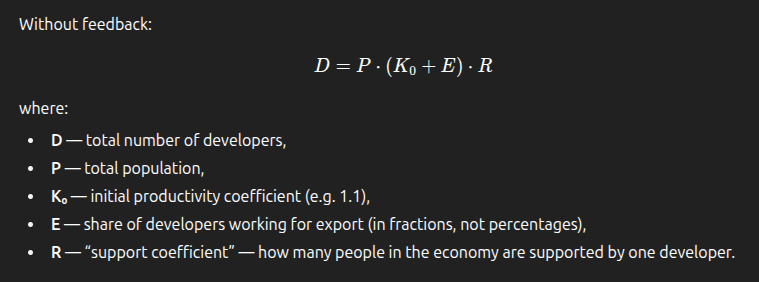
Without feedback:
\[
D = \frac{P \cdot (K_0 + E)}{R}
\]
where:
– P — population size,
– K₀ — initial productivity coefficient (e.g., 1.1),
– E — share of developers working for export (as a fraction, not %),
– R — support ratio (number of people per developer).
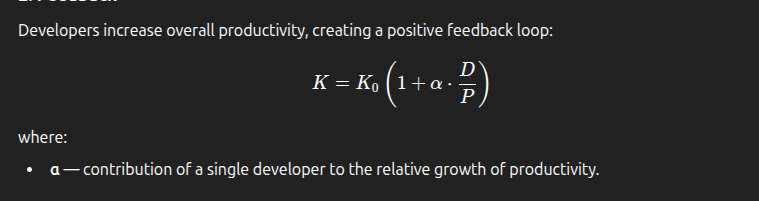
2. Feedback effect
Developers increase overall productivity, creating a positive loop:
\[
K = K_0 \big(1 + \alpha \cdot \frac{D}{P}\big)
\]
where α — the effective contribution of one developer to relative productivity growth.
Substituting and solving for D gives:
\[
t = \frac{K_0 \alpha}{R}, \qquad
D = \frac{P \cdot (K_0 + E)}{R(1 - t)}, \qquad (t < 1)
\]
Interpretation:
– t → 0: weak feedback, close to the base case;
– t increases: stronger feedback and higher D;
– t → 1: nonlinear “explosive” growth (requires natural limits).
3. Components of α
\[
\alpha = \alpha_{raw} \cdot s \cdot a
\]
where:
– α_raw — technical potential (maximum contribution per developer),
– s — share of successfully scaled solutions (success rate),
– a — share of adopted implementations (adoption fraction).
Low s or a values sharply reduce total effect.
4. Time and investment factors
Time and investments are not explicitly in the formula but are reflected via parameters:
– a(t): adoption rate grows slowly if implementation cycles are long;
– s(t): depends on investment level and market access;
– α_raw: infrastructure and technical readiness.
A discrete dynamic model can be added to simulate annual changes.
5. Example calculation
Input parameters:
\[
P = 76{,}000{,}000,\quad R = 125,\quad K_0 = 1.1,\quad E = 0.20
\]
Base value (no feedback):
\[
D_{base} = \frac{P \cdot (K_0 + E)}{R}
\]
Scenarios calculated for:
\[
\alpha_{raw} \in \{0, 0.1, 0.2, 0.4, 0.6\},\quad
s \in \{0.2, 0.5, 0.8\},\quad
a \in \{0.3, 0.6, 1.0\}
\]
6. How to achieve 2× growth in developers (D)
1️⃣ Increase K₀ (base productivity) — invest in real sectors, automation, and IT–industry synergy.
2️⃣ Strengthen feedback (α) — improve scaling (s), adoption (a), and infrastructure (α_raw).
3️⃣ Expand export (E) — increase the share of developers working for foreign markets.
4️⃣ Reduce R — automation, low-code, and centralized DevOps reduce support burden.
5️⃣ Combined approach — moderate growth in K₀ (+20–50%), E (to 30–40%), and higher s, a lead to sustainable 2× growth.
7. Sample scenario
Example:
\[
\alpha_{raw}=0.4,\ s=0.5,\ a=0.6 \Rightarrow \alpha = 0.12
\]
\[
t = \frac{1.1 \times 0.12}{125} \approx 0.001056
\]
The resulting D is only slightly higher than D_base (≈+0.1%).
To double D, E or K₀ must increase significantly, or α must reach 0.5–1.0, which requires systemic measures.
8. Practical roadmap
1. Export (E): support SaaS, freelancing, export platforms, and currency regulation.
2. Success rate (s): promote accelerators, pilot programs, and IT adoption in industry.
3. Adoption (a): provide incentives and credits for IT integration.
4. Infrastructure (α_raw): invest in DevOps, education, and cloud ecosystems.
5. Support ratio (R): automate routine roles, expand low-code tools where applicable.
A few related publications:
Broad vs Narrow specialization
Essay regarding elites
Roadmap to start with software development
The modern education and place of AI here