<?xml version="1.0" encoding="utf-8"?><feed xmlns="http://www.w3.org/2005/Atom" ><generator uri="https://jekyllrb.com/" version="3.10.0">Jekyll</generator><link href="https://gelassen.github.io/feed.xml" rel="self" type="application/atom+xml" /><link href="https://gelassen.github.io/" rel="alternate" type="text/html" /><updated>2026-09-25T10:28:33+00:00</updated><id>https://gelassen.github.io/feed.xml</id><title type="html">Dmitry Kazakov</title><subtitle>Publications for my clients and readers on software engineering and social topics.
</subtitle><author><name>Dmitry Kazakov</name><email>dmitrii.kazakov@gmail.com</email></author><entry><title type="html">Lightweight BI system for university, part III: UX redesign of Teacher Analytics, targeting 5–10 minute weekly review</title><link href="https://gelassen.github.io/2026/09/12/lightweight-BI-system-for-university-part-III.html" rel="alternate" type="text/html" title="Lightweight BI system for university, part III: UX redesign of Teacher Analytics, targeting 5–10 minute weekly review" /><published>2026-09-12T00:00:00+00:00</published><updated>2026-09-12T00:00:00+00:00</updated><id>https://gelassen.github.io/2026/09/12/lightweight-BI-system-for-university-part-III</id><content type="html" xml:base="https://gelassen.github.io/2026/09/12/lightweight-BI-system-for-university-part-III.html"><![CDATA[<!DOCTYPE html>

<html lang="en">
<head>
    <meta charset="UTF-8">
    <meta name="viewport" content="width=device-width, initial-scale=1.0">
    <link rel="stylesheet" href=".css/general.css">
</head>

<body>
    <article>

    <section>
        <h3>Executive summary</h3>

        <p>
            Within a single intensive week, with AI used as a force-multiplier,
            we moved a production educational analytics product from a flat,
            tab-heavy interface toward a layered decision-support workspace.
            The work covered the full cycle: UX and interface trend research,
            a timed key-user scenario, functional information architecture,
            a formal coverage matrix, stakeholder confirmation, visual
            direction, and migration of the working product onto the new UX.
        </p>

        <p>
            The redesign is part of a larger transition. The first version
            was built in <strong>Streamlit</strong> and proved the analytical
            model, but the framework was becoming a constraint for the next
            stage of the product. The new interface is being implemented as
            a <strong>React</strong> workspace, providing considerably more
            control over interaction, information hierarchy and progressive
            disclosure.
        </p>

        <p>
            The original baseline came from direct work in Moodle: a teacher’s
            group performance review took roughly <strong>40 minutes</strong>
            of navigating the LMS gradebook, reports and individual activity
            logs. The product goal has always been to bring that down to
            <strong>5–10 minutes</strong> with explainable analytics.
        </p>

        <p>
            The central UX idea is not simply “fewer tabs”. It is a shorter
            feedback loop:
            <strong>
                what is happening → where is the problem →
                what data confirms it?
            </strong>
            The new interface is organised around this loop. Overview
            establishes the state of the group; Problems identify what
            deserves attention; Data provides the evidence and detailed
            indicators needed to verify and investigate it.
        </p>

        <p>
            This post is the design and product companion to the earlier
            technical write-ups:
            <a href="https://gelassen.github.io/2026/07/11/bi-system-for-university-part-I.html">
                Lightweight BI system for university, part I
            </a>
            and
            <a href="https://gelassen.github.io/2026/08/29/lightweight-BI-for-university-part-II.html">
                part II (how the analytics is built)
            </a>.
            Those posts describe the data model, the rule-based engine and
            the original nine-tab Streamlit surface. Here the focus is on
            <em>why</em> and <em>how</em> the interaction model and technical
            surface are changing.
        </p>
    </section>

    <section>
        <h3>The design problem: from analytics terminal to decision support</h3>

        <p>
            The first version already solved an important technical problem:
            it collected a large amount of educational data and turned it
            into structured, explainable findings. The remaining problem was
            interaction.
        </p>

        <p>
            A teacher does not normally approach an analytics system with
            the question “which dashboard should I open?” The natural
            sequence is closer to:
        </p>

        <ol>
            <li><strong>What is happening?</strong></li>
            <li><strong>Where is the problem?</strong></li>
            <li><strong>What data confirms or explains it?</strong></li>
        </ol>

        <p>
            In the original interface these three jobs were distributed
            across several equally weighted tabs. The user had to assemble
            the relationship between overview, finding and supporting data
            mentally.
        </p>

        <p>
            The redesign therefore does not primarily optimise the number
            of screens. It optimises the <strong>feedback loop between
            interpretation and evidence</strong>.
        </p>

        <p>
            The intended interaction is:
        </p>

        <p>
            <strong>
                Overview → Problems → Evidence in Data → back to the decision
            </strong>
        </p>

        <p>
            This creates a natural progressive-disclosure model. The system
            does not expose its full analytical depth immediately. It reveals
            the next level when the user has a reason to ask for it.
        </p>
    </section>

    <section>
        <h3>Where UX of data-heavy apps actually went</h3>

        <p>
            Before redesigning anything, we re-checked the broader trajectory of
            professional interface design over the last 15 years — not as a
            sequence of visual fashions, but as a gradual shift in what the
            interface is expected to organise.
        </p>

        <ul>
            <li>
                <strong>From chrome to content.</strong>
                One of the first decisive moves was rejecting heavy decorative
                frames and treating the interface itself as secondary. The data,
                the task and the user's context should come first; surrounding
                chrome should recede. This established a simple principle: the
                interface exists to support the work, not to compete with it.
            </li>

            <li>
                <strong>From individual screens to systems.</strong>
                Material Design and parallel design systems then brought a more
                systematic approach: shared components, predictable structure,
                consistent hierarchy and reusable interaction patterns. This
                improved coherence across large products, although it also created
                a new temptation to treat the component library itself as the
                centre of the design.
            </li>

            <li>
                <strong>From visual hierarchy to information hierarchy.</strong>
                The next wave became quieter: less decoration, less visual noise,
                less motion, and more emphasis on legibility, progressive
                disclosure and task efficiency. The important question increasingly
                became not <em>“What can we put on this screen?”</em> but
                <em>“What does the user need to understand or do at this point?”</em>
            </li>

            <li>
                <strong>From information hierarchy to decision flow.</strong>
                For data-heavy applications, this leads to a more fundamental
                shift. The interface does not have to expose analytical
                instruments as the primary navigation model. It can instead
                structure the user's reasoning:
                <strong>what is happening → where is the problem → what data
                confirms it → what should I decide?</strong>
                Dashboards and detailed analytical views do not disappear; they
                become evidence and working instruments inside a larger
                decision-support flow.
            </li>
        </ul>

        <p>
            This is the direction that matters for educational analytics. A
            teacher does not naturally think in terms of dashboards or analytical
            modules. The practical question is closer to:
            <strong>what is happening in my course, where should I pay attention,
            and what evidence supports that conclusion?</strong>
        </p>

        <p>
            So the goal is not to build another analytical terminal. It is to
            provide a calm, hierarchical surface that supports this reasoning
            loop: orient first, identify the problem, verify it with data, and then
            decide — without forcing the teacher to reconstruct the analytical
            model of the system for every weekly review.
        </p>
    </section>

    <section>
        <h3>The old design — what we started from</h3>

        <p>
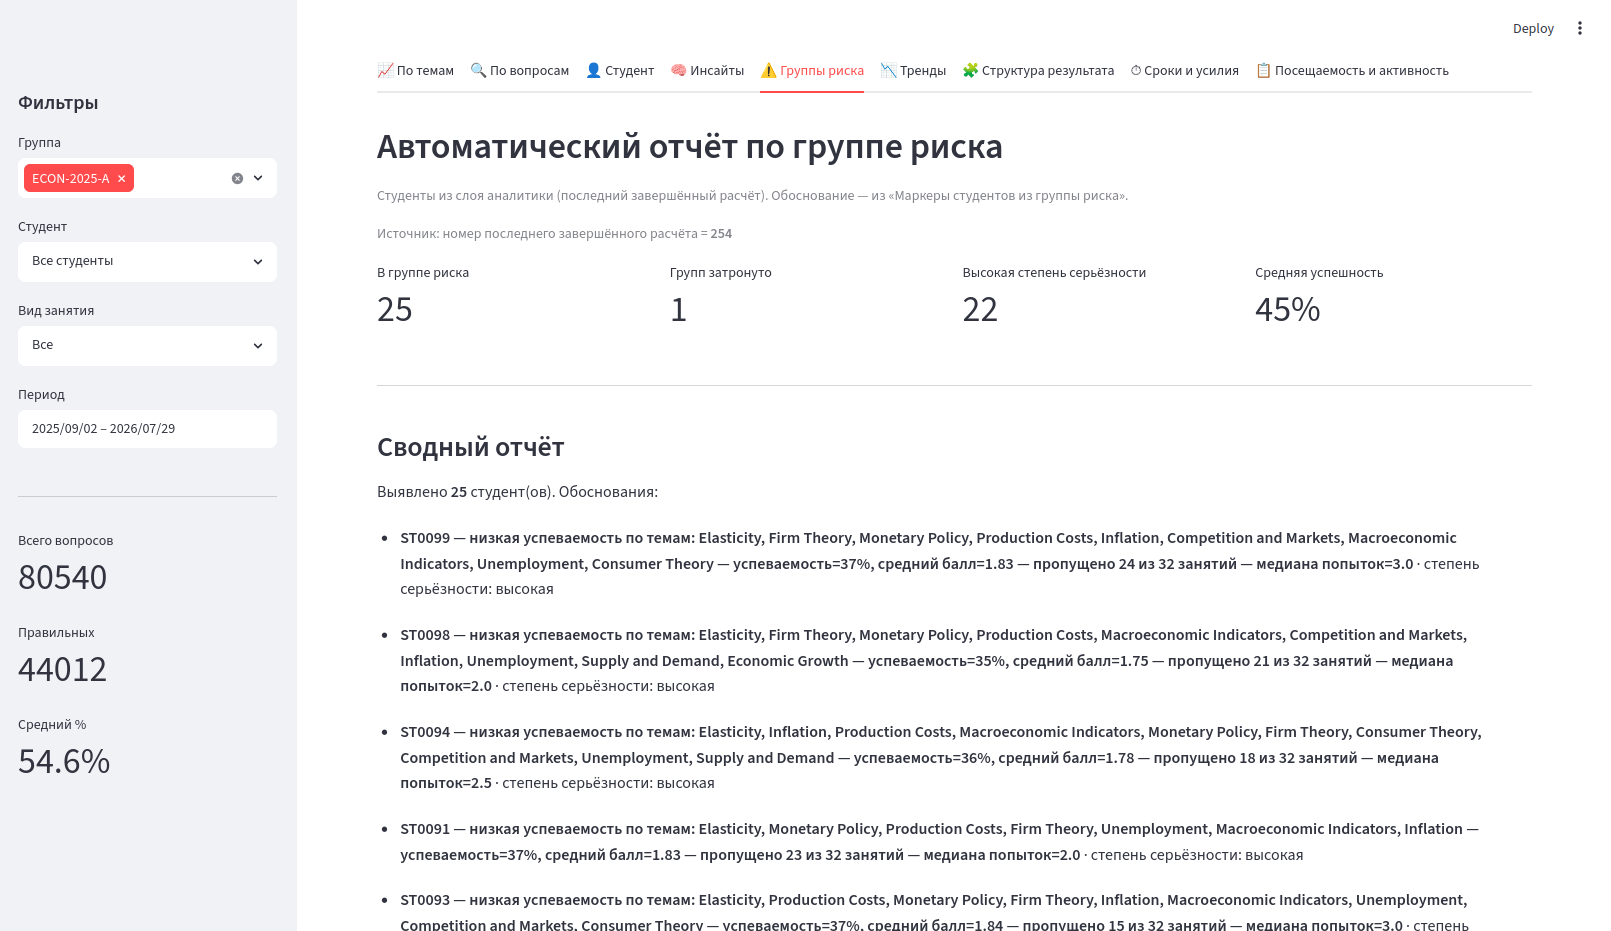
            The first production surface was a <strong>Streamlit</strong>
            dashboard with a global sidebar and nine specialised tabs:
        </p>

        <ul>
            <li>Themes (level-1 “flower” overview)</li>
            <li>Questions</li>
            <li>Student</li>
            <li>Insights</li>
            <li>Risk group</li>
            <li>Trends</li>
            <li>Score structure</li>
            <li>Deadlines / attempts / effort</li>
            <li>Attendance and activity</li>
        </ul>

        <p>
            It already delivered the analytical model: rule-based findings
            with evidence, hypothesis, alternatives, recommendations and
            limits; theme map as orientation anchor; and full coverage of
            the ТЗ queries.
        </p>

        <p>
            <img
                src="/assets/images/2026-09-12/legacy-dashboard.png"
                alt="Legacy Streamlit dashboard"
                style="max-width: 100%; border: 1px solid #ccc;"
            >
        </p>

        <p>
            <strong>Strengths we kept:</strong>
            complete analytical coverage, explainable (non-LLM) findings,
            a solid incremental engine, and the theme map as the central
            orientation device.
        </p>

        <p>
            <strong>
                Pain points that still stood in the way of the 5–10 minute
                target:
            </strong>
        </p>

        <ul>
            <li>
                <strong>Flat information architecture.</strong>
                Nine equally weighted tabs forced constant context
                reconstruction.
            </li>

            <li>
                <strong>Cognitive overload.</strong>
                Dense tables and uniform visual weight made the tool feel
                closer to a terminal than to decision support.
            </li>

            <li>
                <strong>Weak progressive disclosure.</strong>
                Findings and full BI lived on the same mental plane; the
                weekly path had no privileged short route.
            </li>

            <li>
                <strong>Context reconstruction.</strong>
                Moving between tabs could feel like starting over;
                filters lived in a sidebar that was easy to forget.
            </li>

            <li>
                <strong>Technology constraint.</strong>
                Streamlit was useful for validating the analytical concept
                and getting the first working product running quickly.
                As the interaction model became more sophisticated,
                however, it provided less flexibility and control than the
                product required for the next stage.
            </li>
        </ul>

        <p>
            The ~40-minute baseline itself was measured in direct work with
            Moodle (gradebook, reports, activity logs), not on this first
            dashboard. The Streamlit surface was already an attempt to
            shrink that time; the UX redesign removes the remaining
            interaction friction while the technology migration provides
            the flexibility needed to implement the new model properly.
        </p>
    </section>

    <section>
        <h3>Key user scenario broken down by timing</h3>

        <p>
            The primary job is a weekly (or post-control) performance review.
            The original cost was measured in Moodle; the first product
            version reduced part of that cost; the redesign targets the
            remaining friction so the intended path fits the 5–10 minute
            band.
        </p>

        <h4>Baseline — direct work in Moodle (~40 minutes)</h4>

        <ol>
            <li>
                <strong>0–10 min.</strong>
                Open course, gradebook and multiple reports; locate the
                relevant group and period.
            </li>

            <li>
                <strong>10–25 min.</strong>
                Cross-check topic results, individual attempts, attendance
                and activity logs; open students individually where needed.
            </li>

            <li>
                <strong>25–40 min.</strong>
                Mentally synthesise what needs attention — which topics,
                which students, which items to simplify or repeat — and
                form an action list.
            </li>
        </ol>

        <h4>First product version — structured, but still flat</h4>

        <p>
            Nine flat tabs and sidebar filters already replaced raw Moodle
            navigation with structured panels and explainable findings.
            Orientation and cross-referencing, however, still cost time:
            the user had to reconstruct “what is still relevant for this
            slice” after every tab switch.
        </p>

        <h4>After redesign — the intended 5–10 minute path</h4>

        <ol>
            <li>
                <strong>0–30 sec.</strong>
                Global context shows the active slice
                (course › theme › student › work type). Three KPI cards
                and the theme map answer:
                <em>“What is the state of the group?”</em>
            </li>

            <li>
                <strong>30 sec – 3 min.</strong>
                Open Problems (Findings). Prioritised signals show severity,
                a short rationale and “Подробнее”. The user does not need
                to hunt across several analytical tabs.
            </li>

            <li>
                <strong>3–7 min.</strong>
                Open one or two findings into full xAI cards:
                hypothesis, evidence, alternatives, recommendations and
                limits. Drill into a theme or student while the global
                context remains intact.
            </li>

            <li>
                <strong>7–10 min.</strong>
                If a specific indicator or additional confirmation is
                required, move to Data and open the corresponding panel.
                Every ТЗ query still has an address, but the default path
                does not require visiting all of them.
            </li>
        </ol>

        <p>
            The time saving is therefore not simply “fewer screens”.
            It comes from shortening the feedback loop and separating three
            jobs that previously competed on the same flat surface:
            <strong>
                orient → identify the problem → verify with data
            </strong>.
        </p>
    </section>

    <section>
        <h3>Functional design &amp; information architecture</h3>

        <p>
            The redesign does not delete capability. It re-sequences it
            around the teacher's decision process.
        </p>

        <ul>
            <li>
                <strong>Global context</strong>
                (course › theme › topic › student + work type) is always
                visible and never silently reset.
            </li>

            <li>
                <strong>Overview</strong>
                establishes what is happening.
            </li>

            <li>
                <strong>Problems / Findings</strong>
                identifies where attention is required.
            </li>

            <li>
                <strong>Data / Analytics</strong>
                provides the evidence and detailed indicators needed to
                confirm, investigate or challenge the finding.
            </li>

            <li>
                <strong>Theme map (“цветочки”)</strong>
                remains the central orientation device on Overview.
            </li>

            <li>
                <strong>Every ТЗ query 1–14</strong>
                has an explicit address under Data
                (Performance / Learning process / Assessment / Students).
            </li>
        </ul>

        <p>
            The resulting UX contract is deliberately simple:
        </p>

        <p>
            <strong>
                Overview tells me what is happening.<br>
                Problems tell me where to look.<br>
                Data tells me what confirms it.
            </strong>
        </p>

        <p>
            This is the core of the redesign. The three layers are not
            merely different navigation categories; they form a single
            analytical feedback loop on the same data slice.
        </p>

        <p>
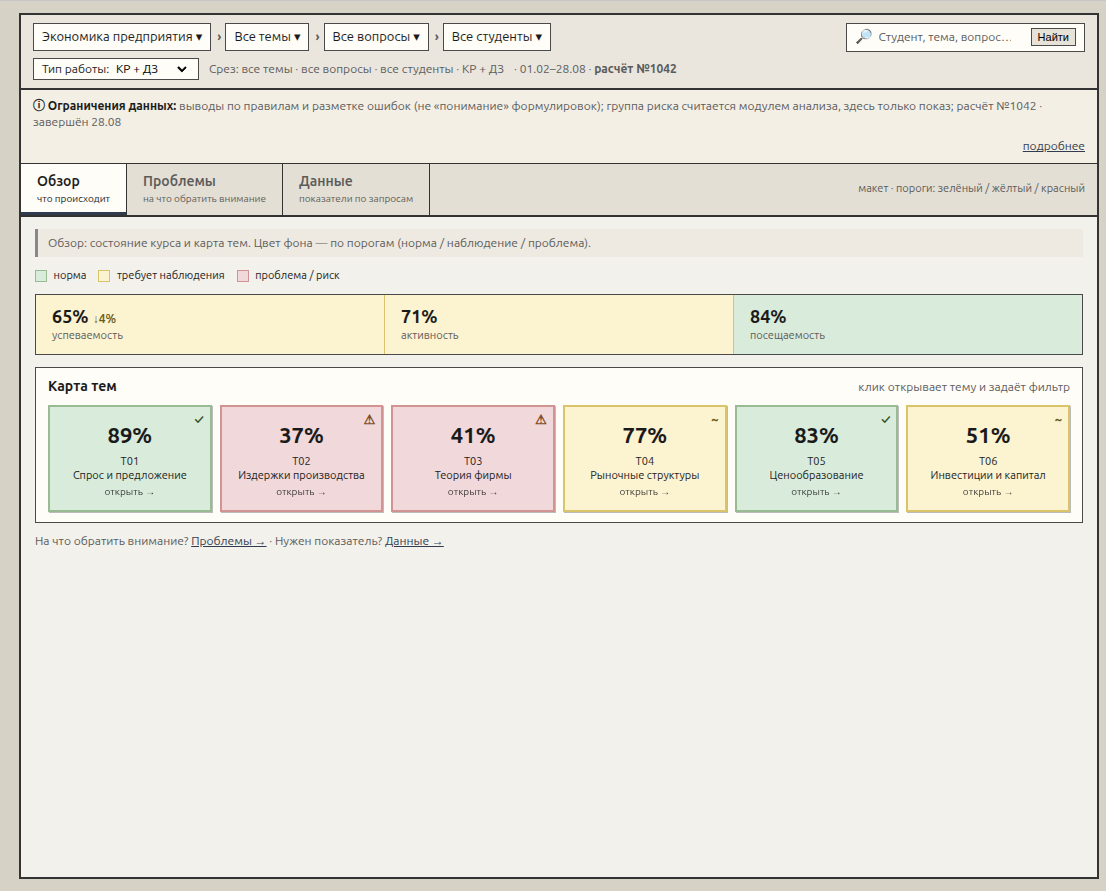
            Functional wireframe of the Overview layer
            (global context + KPIs + theme map):
        </p>

        <p>
            <img
                src="/assets/images/2026-09-12/functional-wireframe.png"
                alt="Functional design — Overview with context bar, KPIs and theme map"
                style="max-width: 100%; border: 1px solid #ccc;"
            >
        </p>

        <p>
            <em>
                Figure 1. Functional design — Overview. Context is persistent;
                colour of theme cards follows thresholds (green / yellow / red).
            </em>
        </p>

        <p>Layer responsibilities:</p>

        <table
            border="1"
            cellpadding="6"
            style="border-collapse: collapse; width: 100%; font-size: 0.95em;"
        >
            <thead style="background: #f0f0f0;">
                <tr>
                    <th>Layer</th>
                    <th>What it contains</th>
                    <th>What it deliberately does not contain</th>
                </tr>
            </thead>

            <tbody>
                <tr>
                    <td><strong>Context</strong> (global)</td>
                    <td>
                        Course › Theme › Topic › Student · Work type ·
                        Slice line + run #
                    </td>
                    <td>
                        Search as primary entry; per-tab filter islands
                    </td>
                </tr>

                <tr>
                    <td><strong>Overview</strong></td>
                    <td>
                        3 KPIs (performance / activity / attendance) +
                        <strong>theme map</strong>
                    </td>
                    <td>
                        Full tables, complete findings list, attempts
                    </td>
                </tr>

                <tr>
                    <td><strong>Problems</strong> (Findings)</td>
                    <td>
                        Prioritised signals for the current slice ·
                        “Подробнее” → Finding + Evidence + Action
                    </td>
                    <td>
                        Full BI catalogue
                    </td>
                </tr>

                <tr>
                    <td><strong>Data</strong> (Analytics)</td>
                    <td>
                        Performance / Learning process / Assessment /
                        Students — all panels for queries 1–14
                    </td>
                    <td>
                        Mandatory “start from a finding” workflow
                    </td>
                </tr>
            </tbody>
        </table>
    </section>

    <section>
        <h3>Coverage matrix — requirements ↔ new UX</h3>

        <p>
            A formal matrix was produced so stakeholders could verify that
            a navigation change does not equal functional loss. Two
            independent acceptance criteria were kept separate:
        </p>

        <ul>
            <li>
                <strong>UX coverage</strong>
                — is the 30-second / 2-minute / 5–10-minute path comfortable?
            </li>

            <li>
                <strong>Requirement coverage</strong>
                — where does each US / ТЗ item live physically?
            </li>
        </ul>

        <p>
            This distinction matters. A simpler interface is not a successful
            redesign if it achieves simplicity by hiding or removing
            required analytical capabilities.
        </p>

        <p>Excerpt (US → UX location in IA v3):</p>

        <table
            border="1"
            cellpadding="6"
            style="border-collapse: collapse; width: 100%; font-size: 0.9em;"
        >
            <thead style="background: #f0f0f0;">
                <tr>
                    <th>Requirement</th>
                    <th>UX location (v3)</th>
                    <th>Coverage</th>
                </tr>
            </thead>

            <tbody>
                <tr>
                    <td>US-1.1 Overview by themes</td>
                    <td>Overview → Theme map</td>
                    <td><strong>yes</strong></td>
                </tr>

                <tr>
                    <td>US-1.4 Short interpretation</td>
                    <td>
                        Problems (Findings); optional signal under map
                    </td>
                    <td><strong>yes</strong></td>
                </tr>

                <tr>
                    <td>US-2.1–2.6 Queries 1–14</td>
                    <td>
                        Data → Performance / Learning / Assessment /
                        Students
                    </td>
                    <td><strong>yes</strong></td>
                </tr>

                <tr>
                    <td>US-3.1–3.4 Context continuity</td>
                    <td>
                        Global context bar + “never silent reset” contract
                    </td>
                    <td><strong>yes</strong></td>
                </tr>

                <tr>
                    <td>US-4.1–4.3 Student / Risk</td>
                    <td>
                        Data → Students / Risk · Student card
                    </td>
                    <td><strong>yes</strong></td>
                </tr>

                <tr>
                    <td>US-5.1–5.2 XAI / patterns</td>
                    <td>
                        Problems → detail → Finding + Evidence + Action
                    </td>
                    <td><strong>yes</strong></td>
                </tr>

                <tr>
                    <td>ТЗ §3.1–3.2 Interpretation &amp; risk</td>
                    <td>
                        Problems · Difficulty · Risk
                    </td>
                    <td><strong>yes</strong></td>
                </tr>
            </tbody>
        </table>

        <p>
            Current → Proposed mapping of the nine Streamlit surfaces was
            also documented: themes → Overview flowers; insights → Problems;
            remaining tabs → Data groups; sidebar → global context.
        </p>

        <p>
            The principle communicated to stakeholders was simple:
            <em>“navigation changed, requirements not lost.”</em>
        </p>
    </section>

    <section>
        <h3>From Streamlit to React</h3>

        <p>
            The UX redesign also exposed a technology decision. The first
            version was intentionally built in Streamlit because it provided
            a fast route from analytical code to a working interface.
            That was appropriate for validating the product concept.
        </p>

        <p>
            As the product evolved, however, the interface itself became
            part of the engineering problem. Persistent context, layered
            navigation, progressive disclosure, richer interactions and
            precise control over the visual hierarchy required more flexibility
            than the original framework comfortably provided.
        </p>

        <p>
            The product is therefore moving from
            <strong>Streamlit to React</strong>.
            This is not a cosmetic technology replacement. It is a migration
            from a rapid analytical surface to a UI architecture capable of
            supporting the intended interaction model.
        </p>

        <p>
            The migration is already more than halfway complete. The remaining
            <strong>Data</strong> layer is deliberately not being redesigned
            from scratch: its role is primarily to bring the existing
            first-version dashboards into the new information architecture.
            This keeps the migration focused on the parts where UX change
            creates the greatest value.
        </p>

        <p>
            In other words, the new architecture changes the route through
            the analytics without requiring the analytical depth itself to
            be rebuilt.
        </p>
    </section>

    <section>
        <h3>Applying the new design — current product</h3>

        <p>
            The new workspace is already implemented for the main interaction
            path. The visible outcomes are:
        </p>

        <ul>
            <li>
                Calm, modern visual system — content before chrome,
                without unnecessary decoration.
            </li>

            <li>
                Persistent global context + three clear layers:
                <strong>Overview / Problems / Data</strong>.
            </li>

            <li>
                Theme map retained as the orientation anchor.
            </li>

            <li>
                Findings list established as the attention layer.
            </li>

            <li>
                xAI cards with hypothesis, evidence, alternatives,
                recommendations and limits remain first-class.
            </li>

            <li>
                The full analytical catalogue remains accessible through
                the Data layer.
            </li>

            <li>
                <strong>
                    Core weekly review path is designed around a
                    5–10 minute target, against a ~40-minute Moodle baseline.
                </strong>
            </li>
        </ul>

        <h4>Overview — what is happening?</h4>

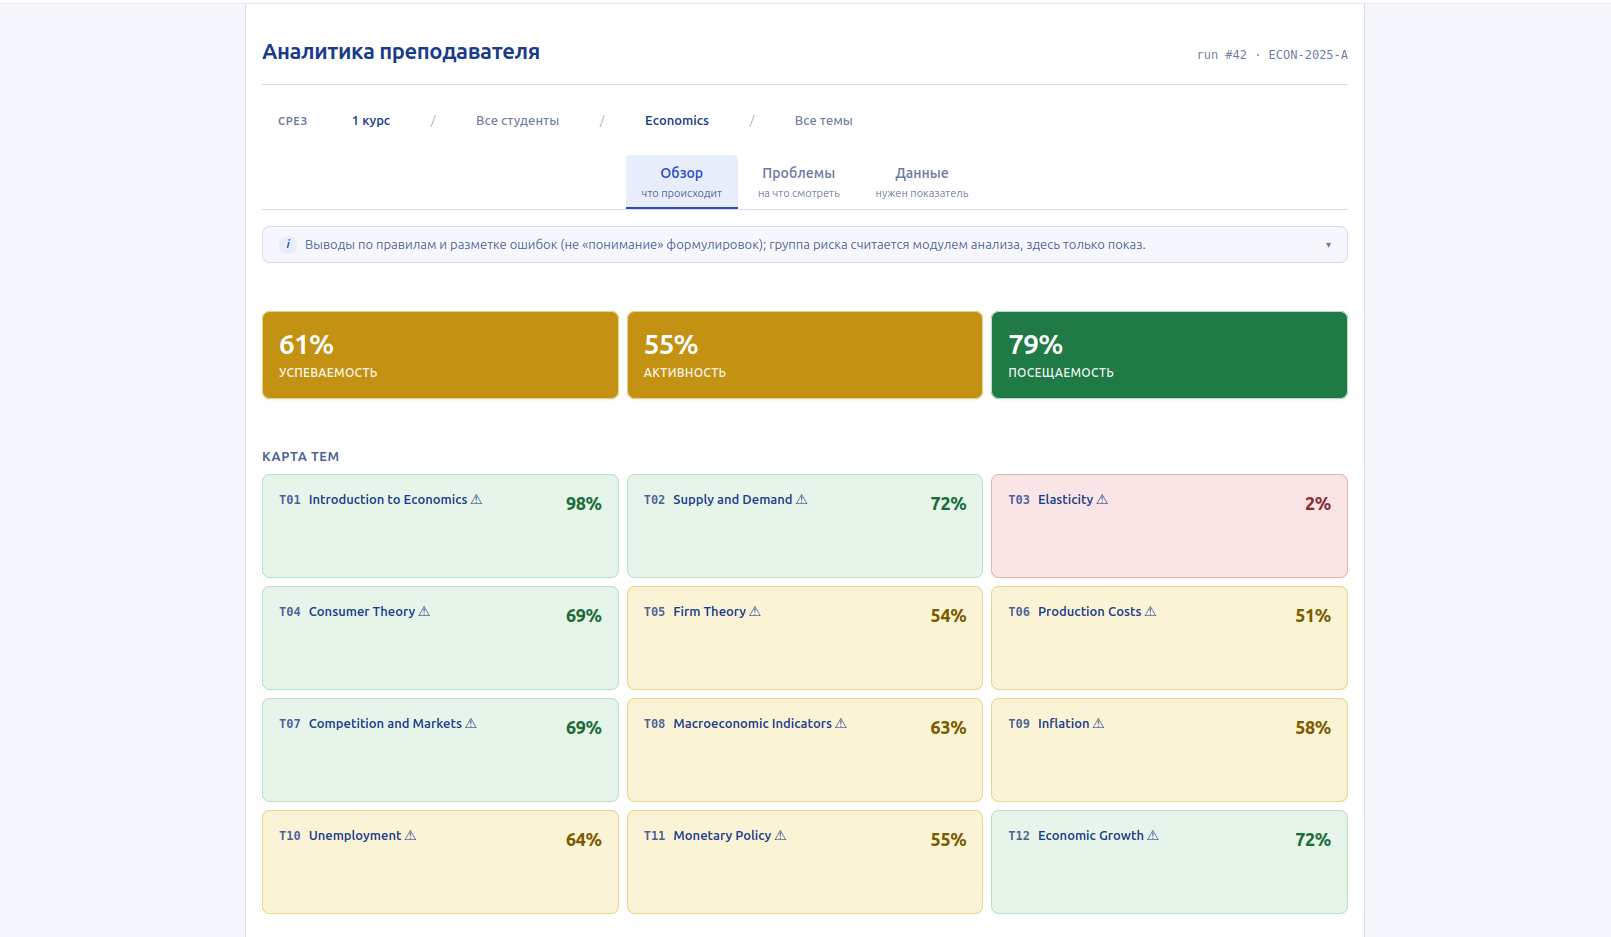
        <p>
            <img
                src="/assets/images/2026-09-12/promo-1.png"
                alt="Product Overview — KPIs and theme map"
                style="max-width: 100%; border: 1px solid #ccc;"
            >
        </p>

        <p>
            <em>
                Figure 2. Production Overview: KPI strip + colour-coded
                theme map.
            </em>
        </p>

        <h4>Problems — where is the problem?</h4>

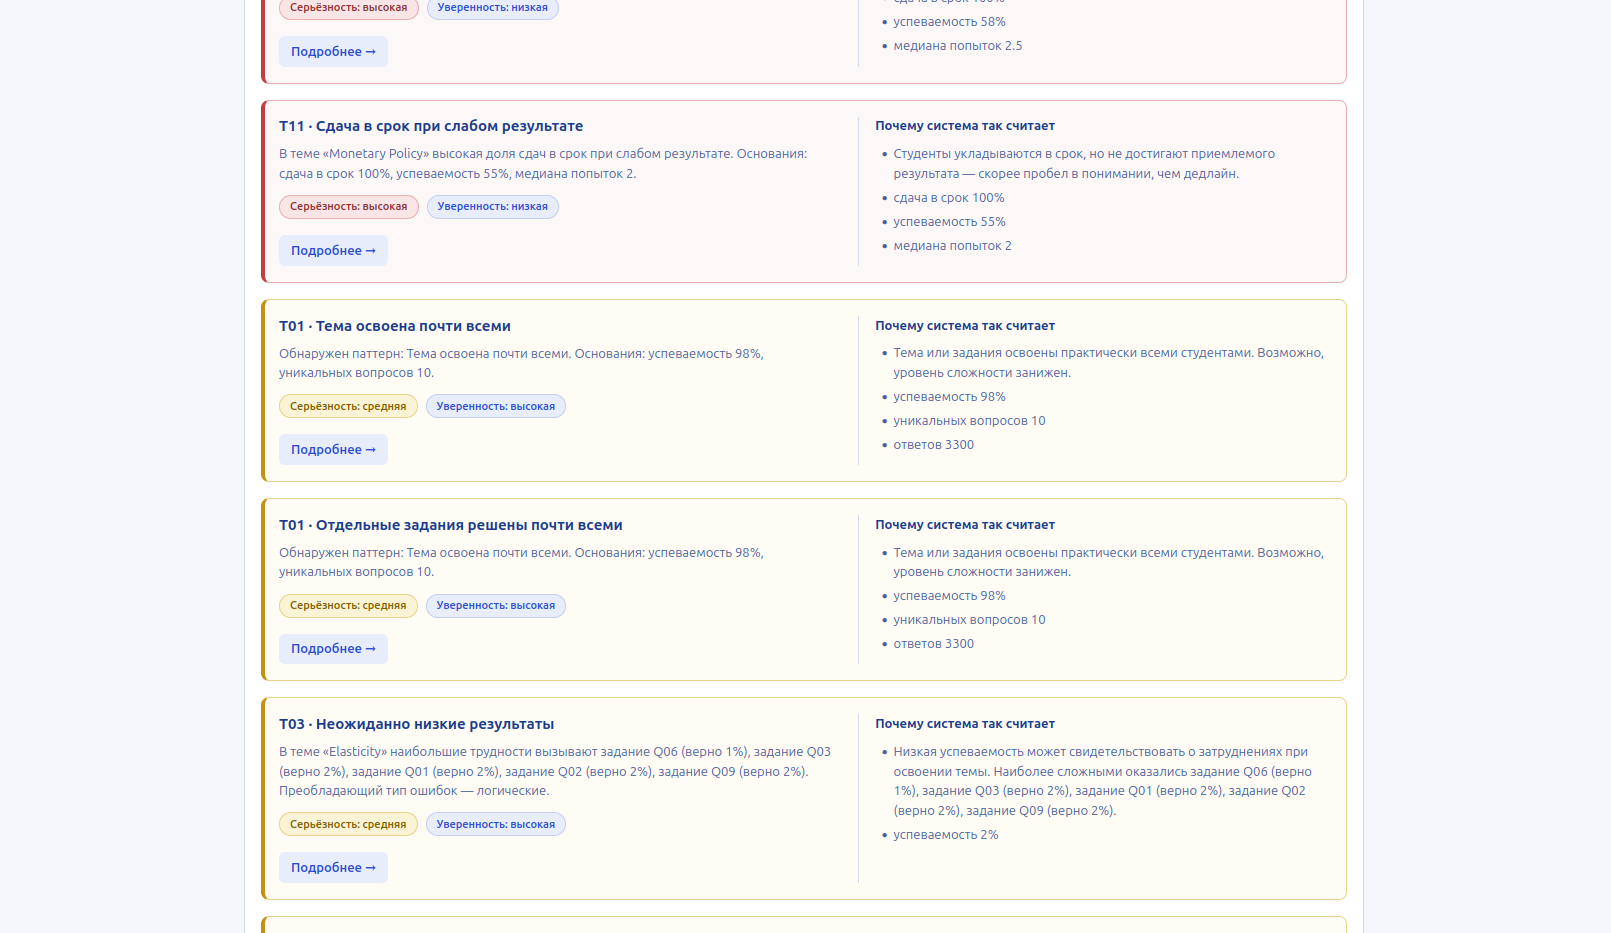
        <p>
            <img
                src="/assets/images/2026-09-12/promo-2.png"
                alt="Findings list with severity"
                style="max-width: 100%; border: 1px solid #ccc;"
            >
        </p>

        <p>
            <em>
                Figure 3. Problems layer: prioritised findings with
                severity and short rationale.
            </em>
        </p>

        <h4>
            Finding detail — why does the system think this is a problem?
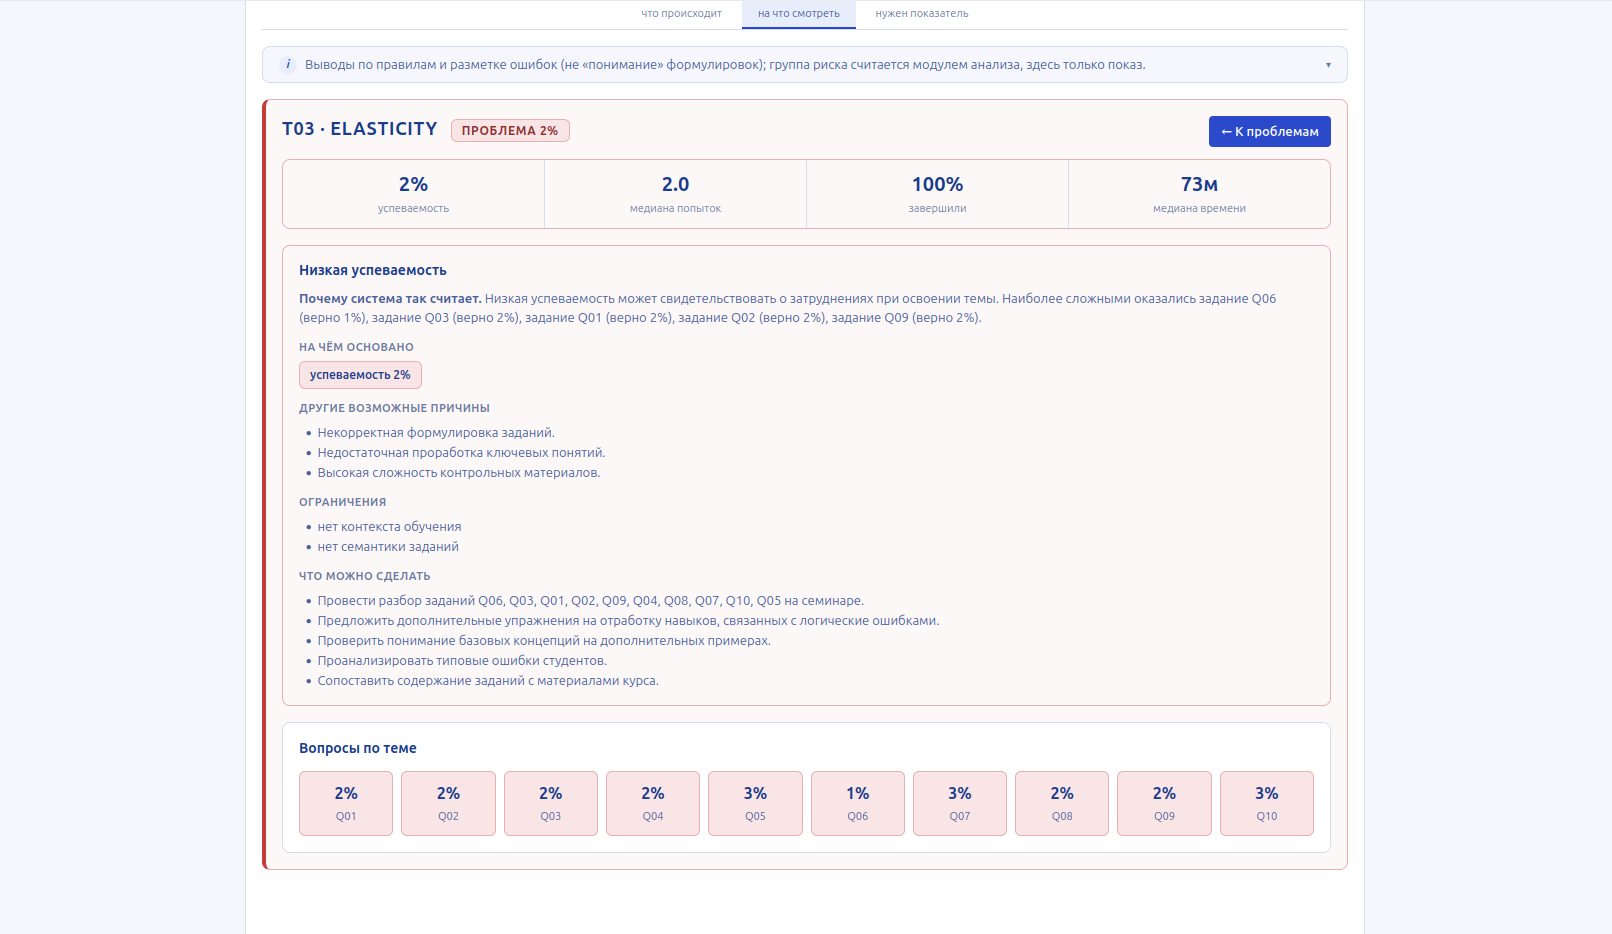
        </h4>

        <p>
            <img
                src="/assets/images/2026-09-12/promo-2-deep.png"
                alt="xAI finding detail card"
                style="max-width: 100%; border: 1px solid #ccc;"
            >
        </p>

        <p>
            <em>
                Figure 4. Full xAI card: hypothesis, evidence, alternatives,
                recommendations and limits.
            </em>
        </p>

        <h4>Data — what confirms it?</h4>

        <p>
            <img
                src="/assets/images/2026-09-12/promo-3.jpg"
                alt="Data layer catalogue"
                style="max-width: 100%; border: 1px solid #ccc;"
            >
        </p>

        <p>
            <em>
                Figure 5. Data layer: Performance, Learning process,
                Assessment quality, Students — full coverage without
                forcing a findings-first workflow.
            </em>
        </p>

        <p>
            The Data layer shown here is currently a design concept.
            Its implementation is the remaining major part of the UX
            migration and is expected to reuse the existing first-version
            dashboards rather than introduce another analytical redesign.
        </p>
    </section>

    <section>
        <h3>Value delivered</h3>

        <p>
            The product is moving from a dense analytical terminal toward
            a decision-support environment built around a much more natural
            sequence of work:
        </p>

        <ul>
            <li>
                <strong>What is happening?</strong>
                Overview provides fast orientation.
            </li>

            <li>
                <strong>Where is the problem?</strong>
                Problems prioritises the signals that deserve attention.
            </li>

            <li>
                <strong>What confirms it?</strong>
                Data provides the underlying indicators and detailed evidence.
            </li>
        </ul>

        <p>
            This preserves the analytical depth of the original product while
            reducing the amount of mental work required to use it.
        </p>

        <ul>
            <li>
                Respects limited attention through progressive disclosure.
            </li>

            <li>
                Keeps every requirement reachable
                (the coverage matrix provides the traceability).
            </li>

            <li>
                Builds trust through transparent, rule-based xAI findings.
            </li>

            <li>
                Preserves analytical depth while making the default path short.
            </li>

            <li>
                Provides a clear route from observation to problem to evidence.
            </li>

            <li>
                Moves the UI from Streamlit to React to support the required
                interaction model and future product development.
            </li>
        </ul>

        <p>
            The target is a focused 5–10 minute weekly review, starting from
            a ~40-minute Moodle baseline. This is a design and product target,
            not yet a post-redesign user-test result.
        </p>

        <p>
            The redesign therefore is not simply a visual refresh. It is a
            change in the interaction model of the product:
            <strong>
                orient → identify → verify → decide.
            </strong>
        </p>

        <p>
            The remaining work is intentionally narrower than the redesign
            already completed: migrate the existing analytical dashboards
            into the Data layer and complete the React migration. The main
            UX architecture and decision-support path are already in place.
        </p>
    </section>

    <section>
        <p>
            Prepared with assistance from ChatGPT and Grok. 
        </p>
    </section>

    <section>
        <h3>Related publications</h3>

        <p>
            <a href="https://gelassen.github.io/2026/07/11/bi-system-for-university-part-I.html">
                Lightweight BI system for university, part I
            </a>
            <br>

            <a href="https://gelassen.github.io/2026/08/29/lightweight-BI-for-university-part-II.html">
                Lightweight BI system for university, part II:
                how the analytics is built
            </a>
            <br>

            <a href="https://gelassen.github.io/2021/02/27/broad-vs-narrow-specialisation.html">
                Broad vs Narrow specialisation
            </a>
        </p>
    </section>

</article>

</body>
</html>]]></content><author><name>Gelassen</name></author><category term="UX," /><category term="BI," /><category term="decision" /><category term="support," /><category term="educational" /><category term="analytics," /><category term="xAI," /><category term="product" /><category term="design" /><summary type="html"><![CDATA[]]></summary></entry><entry><title type="html">Lightweight BI system for university, part II: how the analytics is built</title><link href="https://gelassen.github.io/2026/08/29/lightweight-BI-for-university-part-II.html" rel="alternate" type="text/html" title="Lightweight BI system for university, part II: how the analytics is built" /><published>2026-08-29T00:00:00+00:00</published><updated>2026-08-29T00:00:00+00:00</updated><id>https://gelassen.github.io/2026/08/29/lightweight-BI-for-university-part-II</id><content type="html" xml:base="https://gelassen.github.io/2026/08/29/lightweight-BI-for-university-part-II.html"><![CDATA[<!DOCTYPE html>
<html lang="en">
<head>
<meta charset="UTF-8">
<meta name="viewport" content="width=device-width, initial-scale=1.0">
<title>Lightweight BI system for university, part II: how the analytics is built</title>
<link rel="stylesheet" href=".css/general.css">
</head>
<body>
<article>
<section>
<h3>Executive summary</h3>

<p>
                Part I described the constraints of the project, the synthetic LMS dataset,
                and the overall shape of a lightweight BI system for university instructors:
                reduce group review from roughly <strong>40 minutes to 5–10 minutes</strong>,
                without black-box LLMs for educational decisions, and with
                <strong>explainable AI (xAI)</strong> as a hard requirement.
</p>

<p>
                This part focuses on <strong>how analytics is actually constructed</strong> —
                not on another catalogue of charts, but on the path from raw LMS facts
                to findings that an instructor can accept, reject, or act on.
</p>

<p>
                The system separates two concerns that are often mixed in “AI dashboards”:
</p>

<ul>
<li><strong>Visual panels</strong> — the same kinds of facts that already live in Moodle-like systems,
                    organised for teaching decisions (themes, questions, scores, trends, effort, attendance);</li>
<li><strong>Rule-based insights</strong> — findings with evidence, hypotheses, alternative explanations,
                    confidence, limitations, and recommended interventions.</li>
</ul>

<p>
                Analytics runs in a dedicated <strong>analytics-engine</strong>: incremental batches over
                changed topics, snapshot rules on topic metrics, trend rules on time series,
                student-risk signals, and persisted explanations. The Streamlit dashboard is mostly a
                <strong>reader</strong> of facts and of the latest completed analytics run.
</p>

<p>
                The dashboard exposes <strong>nine tabs</strong>. Together they cover level-1 “flower”
                overviews and level-2 panels aligned with LMS queries (scores, dynamics, score structure,
                deadlines and attempts, difficulty extremes, attendance and activity), plus an insights
                layer and an at-risk group report.
</p>

<p>
                Roughly <strong>thirty</strong> finding types and a separate student-risk signal set
                implement the extraction logic. Listing every rule would turn this post into a reference
                manual. The value is in the <em>extraction pattern</em>. Below, that pattern is shown
                end-to-end, then illustrated with <strong>non-trivial</strong> rules and with three
                screenshots from a live run on synthetic Economics data.
</p>

<p>
                The design principle stays the same as in part I: the system supports judgment;
                it does not replace the instructor.
</p>
</section>

<section>
<h3>Relation to part I</h3>

<table>
<thead>
<tr>
<th>Part I</th>
<th>Part II</th>
</tr>
</thead>
<tbody>
<tr>
<td>Customer, ethics, synthetic data, high-level components</td>
<td>Pipeline of metrics → rules → explanations</td>
</tr>
<tr>
<td>Dashboard mentioned as UI shell</td>
<td>All nine tabs and what each is for</td>
</tr>
<tr>
<td>“Decision support, not charts only”</td>
<td>Concrete finding families, non-trivial rules, screenshots</td>
</tr>
</tbody>
</table>

<p>
                For context on constraints, synthetic generation, and the first version of the UI,
                see
                <a href="https://gelassen.github.io/2026/07/11/bi-system-for-university-part-I.html">Lightweight BI system for university, part I</a>.
</p>
</section>

<section>
<h3>Architectural principle: visualisation vs interpretation</h3>

<p>
                Instructors do not need another dump of averages. They need a short path from
                <em>observation</em> to <em>possible intervention</em>.
</p>

<table>
<thead>
<tr>
<th>Layer</th>
<th>Role</th>
<th>Examples</th>
</tr>
</thead>
<tbody>
<tr>
<td><strong>Facts</strong></td>
<td>LMS-derived tables in the AI database</td>
<td>attempts, question results, attendance, weekly activity</td>
</tr>
<tr>
<td><strong>Metrics</strong></td>
<td>Aggregates per topic / student / period</td>
<td>accuracy, error shares, on-time rate, median attempts, engagement</td>
</tr>
<tr>
<td><strong>Findings</strong></td>
<td>Rule matches with evidence</td>
<td>low accuracy, missed deadline vs did not understand, declining mastery</td>
</tr>
<tr>
<td><strong>Explanations</strong></td>
<td>xAI text structure</td>
<td>observation, hypothesis, alternatives, actions, uncertainty</td>
</tr>
<tr>
<td><strong>UI</strong></td>
<td>Tabs</td>
<td>explore facts; read findings on Insights and Risk</td>
</tr>
</tbody>
</table>

<p>
                Rules are <strong>thresholds + logic</strong>, not generative models.
                Thresholds can be calibrated per course (YAML, optional admin UI) without rewriting rules.
                Empty insights are not always a defect: if every submission is on time, deadline rules
                correctly stay silent; if a topic spans only two weeks, decline-streak rules may not fire.
</p>
</section>

<section>
<h3>How the analytics engine works</h3>

<h4>Incremental batch</h4>

<ol>
<li>Read unprocessed <strong>changes</strong> (topics, results, assignments, activity, …).</li>
<li>Resolve an <strong>impact set</strong> of topic ids.</li>
<li>Hydrate state for those topics (results, attempts, attendance, activity, students).</li>
<li><strong>Compute</strong>: metrics → snapshot rules → trend rules → enrich → explanations → student metrics → risk flags.</li>
<li>Persist a new analytics <strong>run</strong>; acknowledge changes.</li>
</ol>

<p>
                Only touched topics are recomputed. A pipeline lock avoids concurrent writers.
</p>

<h4>Three families of logic</h4>

<table>
<thead>
<tr>
<th>Family</th>
<th>Input</th>
<th>Output</th>
</tr>
</thead>
<tbody>
<tr>
<td><strong>Snapshot</strong> (topic / question)</td>
<td>Topic metrics (+ question context)</td>
<td>Findings: accuracy, errors, effort, deadlines, engagement, none/all solved, …</td>
</tr>
<tr>
<td><strong>Trend</strong></td>
<td>Per-topic time series (e.g. weekly score and attempts)</td>
<td>Declining / improving mastery, rising effort with flat score, volatility</td>
</tr>
<tr>
<td><strong>Student risk</strong></td>
<td>Per-student metrics</td>
<td>Signals + justification + severity (not the same object as topic findings)</td>
</tr>
</tbody>
</table>

<p>
                Every topic finding is expected to carry <strong>evidence</strong> (metric values).
                The explanation layer adds hypothesis, alternatives, recommended actions, and limitations.
</p>

<h4>What the engine deliberately does not do</h4>

<ul>
<li>It does not invent causal certainty (“this student failed because of X”).</li>
<li>It does not replace the Moodle gradebook.</li>
<li>It does not call an LLM to invent recommendations for production educational decisions
                    (customer constraint described in part I).</li>
</ul>
</section>

<section>
<h3>From metrics to a finding: the extraction pattern</h3>

<p>
                Regardless of which of the ~30 finding types fires, the path is the same:
</p>

<ol>
<li><strong>Aggregate</strong> raw rows into a metric row (topic or student).</li>
<li><strong>Evaluate</strong> a pure rule: thresholds + boolean conditions + minimum sample size.</li>
<li><strong>Attach evidence</strong> strings that a human can check against the dashboard tables.</li>
<li><strong>Render</strong> a fixed explanation schema: observation → hypothesis → alternatives → recommendations → limitations.</li>
</ol>

<p>
                The non-trivial part is rarely the inequality <code>accuracy &lt; 0.5</code>.
                It is choosing <em>which combinations of signals</em> change the instructor’s next action,
                and forcing the system to show alternatives when several stories fit the same numbers.
</p>
</section>

<section>
<h3>Non-trivial rules (worked examples)</h3>

<p>
                Trivial rules (“accuracy is low”) are necessary, but they are not where the design
                effort sits. The following three families are more characteristic of the system.
</p>

<h4>1. Deadline versus understanding</h4>

<p>
                LMS attempts carry both a score and an on-time flag (and often duration).
                Two different teaching problems produce similar “weak result” charts:
</p>

<ul>
<li><strong>Missed deadline</strong> — share of on-time submissions is low, but accuracy is still
                    in an “acceptable” band → time management / workload / cutoff design;</li>
<li><strong>Did not understand</strong> — submissions are mostly on time, accuracy is weak,
                    often with many attempts → content, prerequisites, or item design.</li>
</ul>

<p>
                Related variants include on-time submission with very few attempts and a weak score
                (shallow engagement) and a long single attempt with a weak score (stuck without recovery).
                On the current synthetic set, almost all attempts are marked on time, so
                <em>missed deadline</em> correctly does not fire. That is a data property, not a missing rule.
</p>

<h4>2. Multi-signal student risk</h4>

<p>
                Topic findings answer “what is wrong with the theme”.
                Risk answers “who needs attention, with a short rationale”.
</p>

<p>
                A student enters the risk set only when <strong>several</strong> independent signals
                co-occur (weak accuracy across topics, low average score, absences, attempt patterns,
                engagement extremes, late rate, …), above a minimum answer count.
                Severity is derived from how deep accuracy falls and how many signals stack.
                Justification text is assembled from the same signals so the instructor can audit the row
                without opening a black box.
</p>

<p>
<img src="/assets/images/2026-08-29/risk-group-report.png"
                     alt="Automatic at-risk group report: 25 students, severity counts, per-student justification with weak topics, score, absences, median attempts">
</p>

<p>
                In the run shown above, the report lists 25 students, 22 of them at high severity,
                with mean success around 45%. Each line combines weak topics, accuracy, average score,
                missed sessions, and median attempts. That is the “summary report on the risk group with
                rationale” from the original requirements — not a single red flag on one metric.
</p>

<h4>3. Score structure as a bridge to intervention</h4>

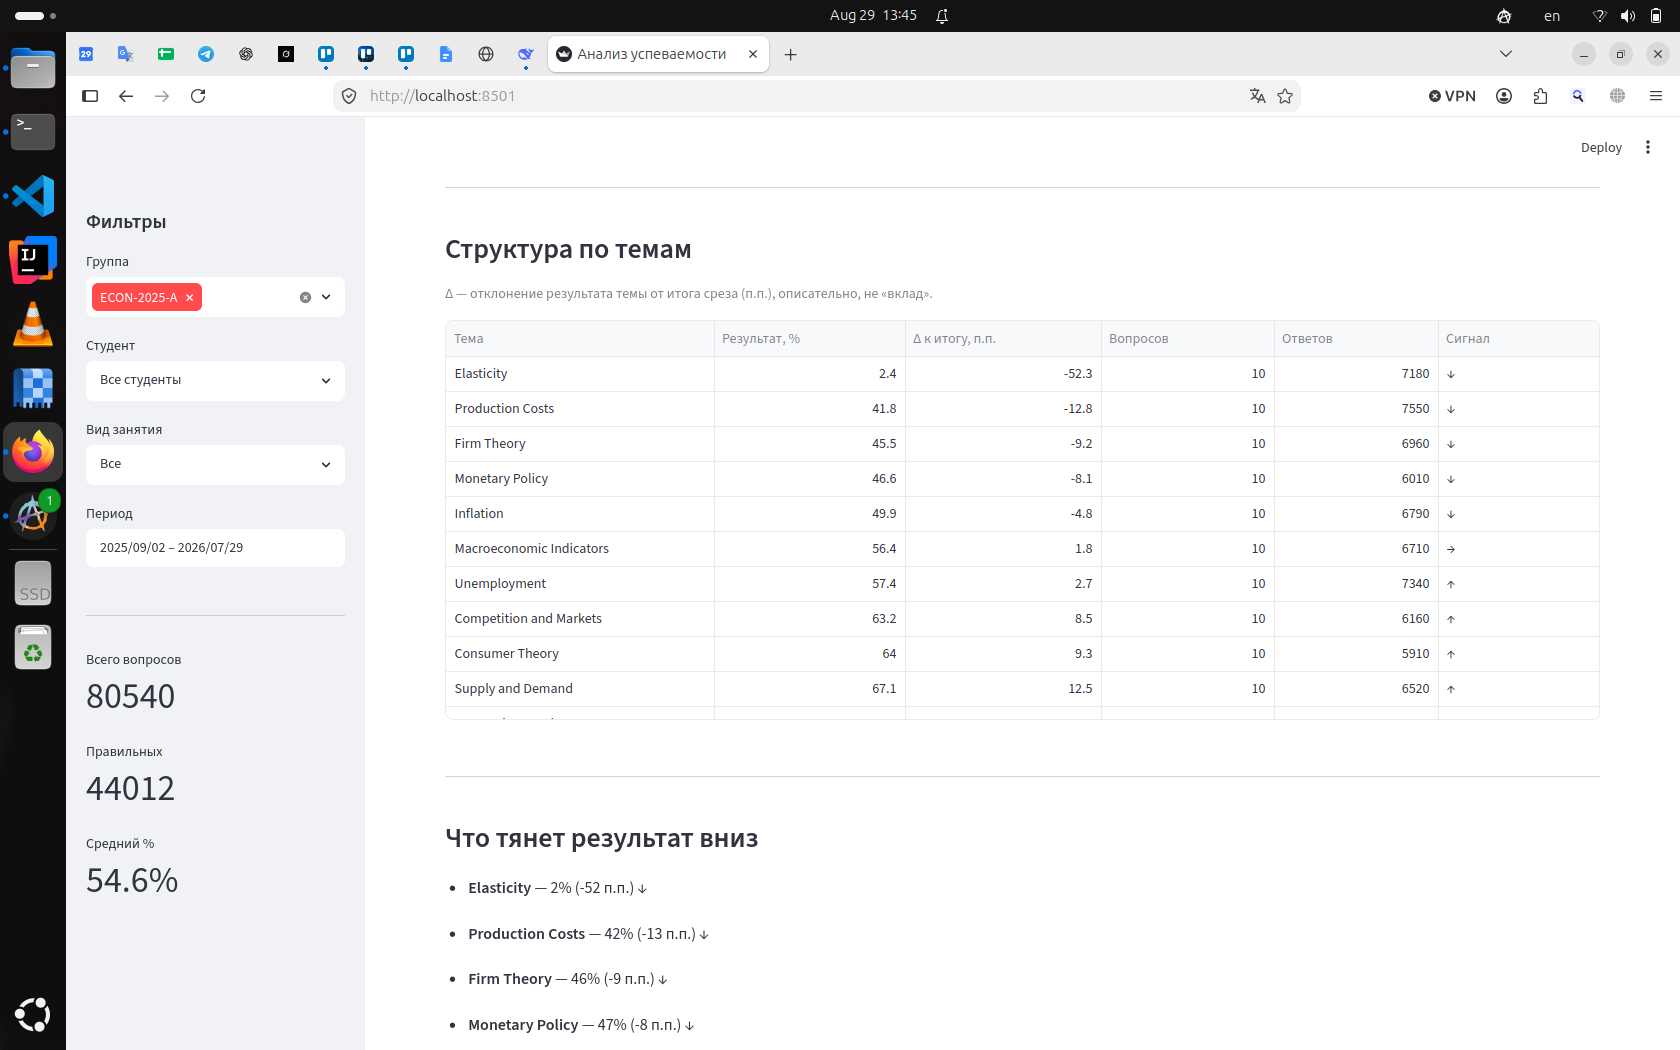
<p>
                Before recommending a seminar on a topic, the instructor needs to see
                <em>how far</em> that topic pulls the cohort below the slice average.
                The score-structure panel ranks themes by result and by delta to the overall mean
                (descriptive gap, not a causal “contribution” claim).
</p>

<p>
<img src="/assets/images/2026-08-29/score-structure-themes.png"
                     alt="Score structure by theme: Elasticity at 2.4% with −52.3 pp vs slice average, listed under what pulls the result down">
</p>

<p>
                Elasticity sits at roughly 2% with a −52 percentage-point gap to the slice average.
                Production Costs, Firm Theory, and Monetary Policy follow with smaller negative deltas.
                The same numbers feed snapshot findings; the table is the visual counterpart of
                “what to open first on Insights”.
</p>

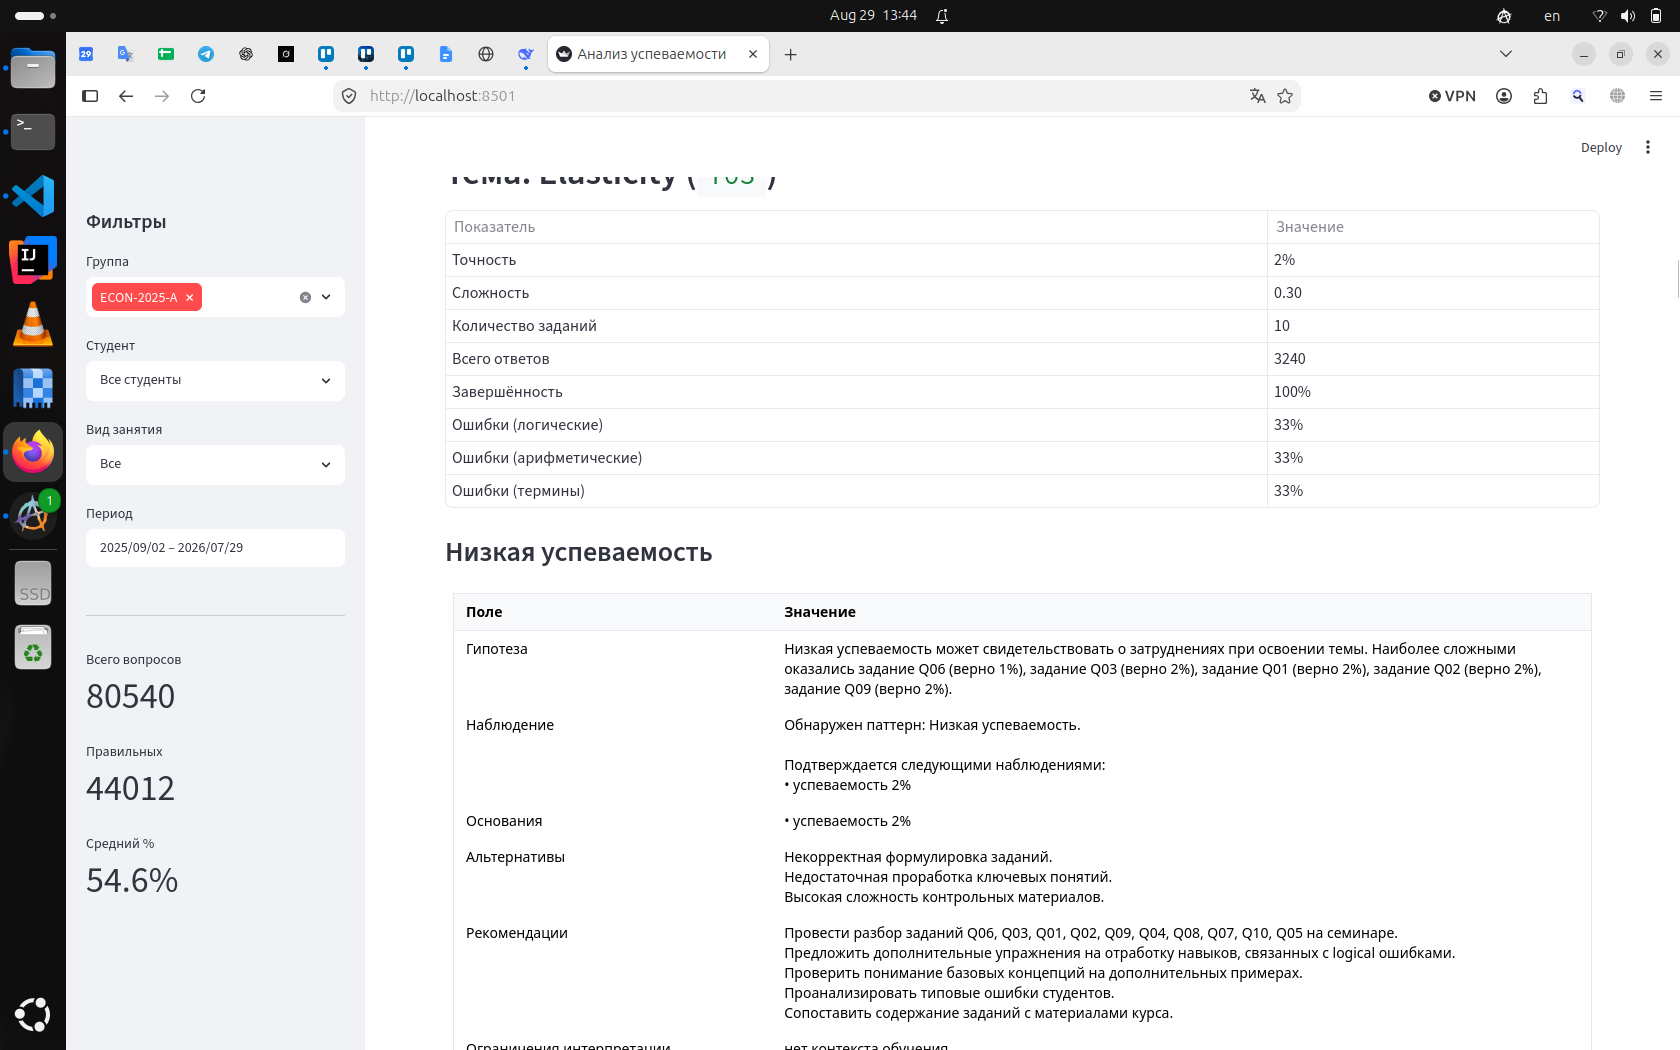
<h4>4. Insights card: full xAI schema on a hard theme</h4>

<p>
                When a theme such as Elasticity collapses to ~2% accuracy with full completion,
                a low-accuracy (or none-solved) rule is expected. The product value is not the label;
                it is the structured card the instructor actually reads.
</p>

<p>
<img src="/assets/images/2026-08-29/insight-elasticity-low-accuracy.png"
                     alt="Insights card for theme Elasticity: accuracy 2%, hypothesis, observation, evidence, alternatives, recommendations, interpretation limits">
</p>

<p>
                The card separates:
</p>

<ul>
<li><strong>Hypothesis</strong> — possible teaching meaning, including the hardest items (Q06, Q03, …);</li>
<li><strong>Observation / evidence</strong> — the pattern and the supporting rate;</li>
<li><strong>Alternatives</strong> — poor item wording, weak prerequisites, overly hard control materials
                    (so “bad students” is not the only story);</li>
<li><strong>Recommendations</strong> — concrete seminar focus, drills on logical errors, checks of basic concepts;</li>
<li><strong>Limits</strong> — e.g. missing instructional context (what was taught that week).</li>
</ul>

<p>
                That structure is applied across finding types. Adding a new rule means implementing
                the same contract, not inventing a new prose style per metric.
</p>
</section>

<section>
<h3>The nine tabs</h3>

<p>
                Global sidebar filters (group, student, assignment type, period) apply across the
                visual tabs. Insights and risk read the latest completed analytics run.
</p>

<h4>1. Themes (level-1 “flowers”)</h4>
<p>
                <strong>Question:</strong> where does the cohort struggle by topic?<br>
                Performance and error structure (logical / arithmetic / terminology).
                Snapshot rules on accuracy, error dominance, pressure, all/none solved continue
                on the Insights tab.
</p>

<h4>2. Questions</h4>
<p>
                <strong>Question:</strong> which items are too hard or too easy?<br>
                Item-level success rates; question rules such as almost nobody / almost everybody solved
                support simplify / complicate recommendations.
</p>

<h4>3. Student</h4>
<p>
                <strong>Question:</strong> how is one student doing across topics?<br>
                Drill-down in the current filter slice. Multi-signal problems surface on Risk group.
</p>

<h4>4. Insights</h4>
<p>
                <strong>Question:</strong> what stands out, and what might I do?<br>
                Main surface for topic and question findings after explanation generation —
                the “intelligent assistant” layer, not a second gradebook.
</p>

<h4>5. Risk group</h4>
<p>
                <strong>Question:</strong> who needs attention, and why?<br>
                Named students with severity and justification. Complements Insights
                (theme problems versus people).
</p>

<h4>6. Trends</h4>
<p>
                <strong>Question:</strong> is mastery rising or falling over time?<br>
                Score and attempts over periods. Trend findings (decline, improve, effort up with flat score,
                volatility) need a long enough series per topic; short sequential courses may yield few hits.
</p>

<h4>7. Score structure</h4>
<p>
                <strong>Question:</strong> what pulls the observed result down?<br>
                Descriptive ranking and deltas (screenshot above). Exploration first; Insights still carry
                formal findings.
</p>

<h4>8. Deadlines, attempts, and effort</h4>
<p>
                <strong>Question:</strong> did they run out of time, or fail to understand?<br>
                On-time rate, median attempts, time-on-task, score side by side — the metric surface for
                the deadline-versus-understanding rules.
</p>

<h4>9. Attendance and activity</h4>
<p>
                <strong>Question:</strong> do absences or empty LMS activity explain weak results?<br>
                Attendance and engagement crossed with scores; topic-level patterns and student-risk signals
                (e.g. high engagement with low results, low attendance with low results).
</p>
</section>

<section>
<h3>Cross-cutting behaviour</h3>

<ul>
<li><strong>Empty insights are not always a bug.</strong> Rules fire on patterns present in the facts.</li>
<li><strong>Insights ≠ all nine tabs.</strong> Tabs 1–3 and 6–9 are exploration; 4–5 carry structured conclusions.</li>
<li><strong>Human remains responsible.</strong> Alternatives and limitations are part of the product.</li>
<li><strong>Production data path (forward-looking):</strong> Moodle primary → isolated replica → ETL into the AI database → engine → dashboard. Applications do not connect to the LMS primary.</li>
</ul>
</section>

<section>
<h3>What this implies for “AI in education” dashboards</h3>

<p>
                A large share of educational “AI” demos still jumps from a chart to a paragraph
                of model-generated advice. This prototype takes the opposite route:
                measurable indicators first, rule matches second, prose last — and only inside a fixed schema.
</p>

<p>
                That is slower to market as a feature list, but it matches the customer constraint
                (no LLM for graded educational decisions) and matches how instructors already argue
                in staff meetings: numbers, competing explanations, then a concrete next step.
</p>
</section>

<section>
<h3>Next steps</h3>

<ul>
<li>Deep-links from a finding to the matching visual tab with filters preserved;</li>
<li>Instructor auth / RBAC before wide production use;</li>
<li>Calibration of thresholds on real course extracts once the replica + ETL path is live;</li>
<li>Richer synthetic (or real) patterns for rare rules — e.g. late submissions, long per-topic time series.</li>
</ul>
</section>

<section>
<h3>Related publications</h3>
<p>
<a href="https://gelassen.github.io/2026/07/11/bi-system-for-university-part-I.html">Lightweight BI system for university, part I</a><br>
<a href="https://gelassen.github.io/2026/09/12/lightweight-BI-system-for-university-part-III.html">Lightweight BI system for university, part III: UX redesign targeting 5–10 minute weekly review</a> <br>
<a href="https://gelassen.github.io/2026/06/19/artificial-intelligence-in-education-and-management.html">Artificial Intelligence in Education and Management</a><br>
</p>
</section>
</article>
</body>
</html>]]></content><author><name>Gelassen</name></author><category term="BI," /><category term="custom" /><category term="software" /><category term="development," /><category term="decision" /><category term="making" /><category term="support," /><category term="xAI" /><summary type="html"><![CDATA[Lightweight BI system for university, part II: how the analytics is built Executive summary]]></summary></entry><entry><title type="html">Medical Workforce Capacity Model to support top management decisions in healthcare</title><link href="https://gelassen.github.io/2026/08/23/math-model-of-healthcare-sustainability.html" rel="alternate" type="text/html" title="Medical Workforce Capacity Model to support top management decisions in healthcare" /><published>2026-08-23T00:00:00+00:00</published><updated>2026-08-23T00:00:00+00:00</updated><id>https://gelassen.github.io/2026/08/23/math-model-of-healthcare-sustainability</id><content type="html" xml:base="https://gelassen.github.io/2026/08/23/math-model-of-healthcare-sustainability.html"><![CDATA[<!DOCTYPE html>
<html lang="en">
  <head>
    <meta charset="UTF-8" />
    <meta name="viewport" content="width=device-width, initial-scale=1.0" />
    <link rel="stylesheet" href="./css/general.css" />
    <script type="text/javascript" async
      src="https://cdn.jsdelivr.net/npm/mathjax@3/es5/tex-mml-chtml.js">
    </script>
  </head>
  <body>
    <article>

      <!-- ========== SUMMARY ========== -->
      <section>
        <h3>Summary</h3>
        <p>
          The Russian healthcare system faces not merely a question of the current number of physicians.
        </p>
        <p>
          A more fundamental question is this:
        </p>
        <blockquote>
          <strong>
            Is the healthcare system capable of independently reproducing sufficient medical capacity
            amidst demographic shifts in the population, the aging of the physician corps, the retirement
            of senior generations, changes in the attractiveness of medical education, and the rise of
            alternatives for young specialists?
          </strong>
        </blockquote>
        <p>
          This question is fundamentally different from "How many doctors does Russia need?"
        </p>
        <p>
          The number of physicians is only one variable. For system sustainability, the following
          factors are simultaneously important:
        </p>
        <ul>
          <li>physician numbers;</li>
          <li>age structure;</li>
          <li>specialty;</li>
          <li>region;</li>
          <li>actual employment;</li>
          <li>professional longevity;</li>
          <li>influx of new specialists;</li>
          <li>residency completion;</li>
          <li>retention of physicians in the profession;</li>
          <li>working conditions;</li>
          <li>income relative to alternative professions;</li>
          <li>productivity;</li>
          <li>digitalization;</li>
          <li>preservation of institutional medical experience.</li>
        </ul>
        <p>
          In 2026, signals emerged that warrant separate analysis.
        </p>
        <p>
          On one hand, the Ministry of Health reports that for 20,000 budget‑funded residency positions,
          39,000 applications were submitted, and therefore considers it premature to speak of a
          systemic shortfall.
        </p>
        <p>
          On the other hand, major medical universities reported hundreds of unfilled budget‑funded
          residency positions and announced additional enrollment. As of mid‑August, vacancies were
          reported at Pirogov Russian National Research Medical University, Sechenov First Moscow
          State Medical University, the Russian Medical Academy of Continuing Professional Education,
          and other institutions.
        </p>
        <p>
          These observations do not contradict each other. Overall competition may remain high, while
          simultaneously individual regions, specialties, or targeted positions may experience candidate
          shortages.
        </p>
        <p>
          This is precisely why what is needed is not a single competition statistic, but a dynamic
          model of medical workforce reproduction.
        </p>
        <p>
          <strong>It is proposed to create a Medical Workforce Capacity Model (MWCM).</strong>
        </p>
        <p>
          Its task is not to provide a "precise forecast through 2045," but to determine:
        </p>
        <ul>
          <li>which parameters determine the sustainability of the medical system;</li>
          <li>which of them are most sensitive;</li>
          <li>where shortages emerge first;</li>
          <li>what effect each individual parameter change produces;</li>
          <li>what the delay is between a policy decision and its result;</li>
          <li>which measures compensate for demographic decline;</li>
          <li>where the boundary lies between temporary shortage and self‑sustaining workforce crisis.</li>
        </ul>
      </section>

      <!-- ========== WHAT THE MODEL DOES NOT DO ========== -->
      <section>
        <h3>What the Model Does NOT Do</h3>
        <p>
          To avoid misinterpretation, it is essential to state clearly what MWCM is <em>not</em>:
        </p>
        <ul>
          <li>It is <strong>not</strong> a demographic forecast of the total number of physicians in 2045.</li>
          <li>It is <strong>not</strong> a detailed workforce plan for the entire country.</li>
          <li>It is <strong>not</strong> a justification for indiscriminately increasing or decreasing
            budget‑funded places without considering specialty and region.</li>
          <li>It is <strong>not</strong> a substitute for clinical expertise or evidence‑based medicine.</li>
          <li>It is <strong>not</strong> an excuse to lower training standards or quality of care.</li>
          <li>It is <strong>not</strong> a crystal ball — it is a tool for exploring dependencies,
            comparing scenarios, and identifying leverage points.</li>
        </ul>
        <p>
          The model is useful precisely because it makes visible the trade‑offs and time lags that
          are otherwise hidden in aggregated statistics.
        </p>
      </section>

      <!-- ========== 1. THE PROBLEM ========== -->
      <section>
        <h3>1. The Problem</h3>
        <p>
          Traditional workforce planning often relies on metrics such as:
        </p>
        <ul>
          <li>physicians per 10,000 population;</li>
          <li>number of graduates;</li>
          <li>number of budget‑funded places;</li>
          <li>number of vacancies;</li>
          <li>number of applications;</li>
          <li>average physician age.</li>
        </ul>
        <p>
          These indicators are necessary but insufficient.
        </p>
        <p>
          For example, a system can simultaneously have a large number of students, high competition
          for medical schools, physician shortages in regions, an excess of candidates for some
          specialties, unfilled positions in others, a large number of older physicians, growing
          workload, and increasing healthcare expenditures.
        </p>
        <p>
          This is not a contradiction. It is the result of different parts of the system moving at
          different speeds.
        </p>
      </section>

      <!-- ========== 2. CORE IDEA ========== -->
      <section>
        <h3>2. Core Idea of the Model</h3>
        <p>
          It is proposed to distinguish between the number of physicians \(D_t\) and effective
          medical capacity \(EC_t\).
        </p>
        <p>
          Effective capacity is determined not only by the number of physicians:
        </p>
        \[
          EC_t = D_t \times A_t \times P_t
        \]
        <p>where:</p>
        <ul>
          <li>\(D_t\) — number of physicians;</li>
          <li>\(A_t\) — actual availability of physicians for clinical work (share of working time
            spent on direct patient care);</li>
          <li>\(P_t\) — productivity per physician (e.g., number of consultations or procedures
            per unit of clinical time).</li>
        </ul>
        <p>
          A 10% increase in the number of physicians does not necessarily mean a 10% increase in
          medical capacity. If at the same time bureaucratic burden has grown, actual employment has
          decreased, or patients have become more complex, the effect may be substantially smaller.
          Conversely, automation of part of the work may increase effective capacity with an almost
          unchanged number of physicians.
        </p>
      </section>

      <!-- ========== 3. REPRODUCTION ========== -->
      <section>
        <h3>3. Reproduction of the Physician Corps</h3>
        <p>
          The number of physicians changes as a stock affected by flows:
        </p>
        \[
          D_{t+1} = D_t + N_t + I_t - R_t - L_t
        \]
        <p>where:</p>
        <ul>
          <li>\(N_t\) — new physicians entering practice;</li>
          <li>\(I_t\) — immigration inflow;</li>
          <li>\(R_t\) — exit from the profession due to age;</li>
          <li>\(L_t\) — other losses: leaving clinical medicine, career change, emigration,
            transition to administrative roles, etc.</li>
        </ul>
        <p>
          This yields the first key indicator — the physician reproduction rate:
        </p>
        \[
          RR_t = \frac{N_t + I_t}{R_t + L_t}
        \]
        <p>Interpretation:</p>
        <ul>
          <li>\(RR > 1\) — generation is reproducing;</li>
          <li>\(RR = 1\) — approximate equilibrium;</li>
          <li>\(RR < 1\) — the physician stock begins to structurally contract.</li>
        </ul>
        <p>
          What matters is not only the national \(RR\), but also \(RR\) by region and specialty.
        </p>
      </section>

      <!-- ========== 4. GENERATIONAL CHANGE ========== -->
      <section>
        <h3>4. Why Generational Change Is a Separate Problem</h3>
        <p>
          The physician corps has an age structure. Therefore, it is necessary to model age groups:
          25–29, 30–34, 35–39, 40–44, 45–49, 50–54, 55–59, 60–64, 65–69, 70+.
        </p>
        <p>
          This allows us to see not only the current shortage, but also the future wave of attrition.
          Particularly important is the situation where the younger generation is smaller than the
          older generation approaching retirement. In this case, the problem becomes partially
          predetermined.
        </p>
      </section>

      <!-- ========== 4.5 REGIONAL RISK ========== -->
      <section>
        <h3>4.5. Regional Heterogeneity as a Separate Risk</h3>
        <p>
          National averages mask deep regional disparities. Even if the national \(RR = 1\),
          individual regions may have \(RR = 0.6\) while others have \(RR = 1.4\).
        </p>
        <ul>
          <li>National aggregates hide crisis points;</li>
          <li>Physician mobility between regions is limited;</li>
          <li>Solutions must be tailored to specific regional and specialty contexts.</li>
        </ul>
        <p>
          Therefore, the model should output a <strong>map of \(RR\) by region and specialty</strong>,
          not a single national number.
        </p>
      </section>

      <!-- ========== 5. LOSS OF EXPERIENCE ========== -->
      <section>
        <h3>5. Loss of Experience — A Separate Component of Risk</h3>
        <p>
          The departure of a physician means the loss of not just one working unit. In some cases,
          along with the physician, the system loses accumulated clinical experience, the ability to
          recognize rare cases, knowledge of local processes, mentoring skills, informal
          problem‑solving approaches, and institutional memory.
        </p>
        <p>
          Therefore, capacity loss ≠ numerical loss. In some specialties, capacity loss significantly
          exceeds numerical loss.
        </p>
        <p>
          This is precisely where this model connects with the previously proposed concept of
          <em>Digital Memory of Medical Institutions</em> — the preservation and reuse of accumulated
          clinical experience. The concept envisions creating an infrastructure layer atop existing
          medical information systems that transforms documented practice into structured,
          traceable, and reusable institutional memory.
        </p>
      </section>

      <!-- ========== 6. EDUCATIONAL PIPELINE ========== -->
      <section>
        <h3>6. The Educational Pipeline</h3>
        <p>
          A physician does not appear in the system immediately after the state decides to increase
          the number of budget‑funded places. Simplistically:
        </p>
        \[
          S_t \rightarrow M_t \rightarrow G_t \rightarrow O_t \rightarrow N_t
        \]
        <p>
          where \(S_t\) — potential applicant pool; \(M_t\) — admitted; \(G_t\) — graduates;
          \(O_t\) — those completing required specialization; \(N_t\) — entering practice.
        </p>
        <p>
          Thus, a budget‑funded place ≠ a future physician. There are several filters between them.
        </p>
      </section>

      <!-- ========== 7. CHOICE OF MEDICINE ========== -->
      <section>
        <h3>7. A Young Person's Choice of Medicine</h3>
        <p>
          The number of potential physicians depends not only on demography. Simplistically:
        </p>
        \[
          N_t = S_t \times C_t \times G_t \times O_t \times R_t
        \]
        <p>
          where \(C_t\) — probability of choosing a medical career. It depends on expected income,
          duration of training, working conditions, professional autonomy, prestige, legal liability,
          emotional burden, career advancement opportunities, geographic mobility, residency
          conditions, and alternative careers.
        </p>
      </section>

      <!-- ========== 8. PRICE OF ALTERNATIVES ========== -->
      <section>
        <h3>8. The Price of Alternatives</h3>
        <p>
          For a young person, medicine does not compete with "nothing." It competes with IT,
          engineering, finance, entrepreneurship, management, applied science, and other
          high‑skilled professions.
        </p>
        <p>
          Therefore, it is necessary to account for the opportunity cost of choosing medicine
          (\(OC\)): alternative income + flexibility + mobility + speed to income + career
          opportunities.
        </p>
        <p>
          Even a high absolute physician salary may be insufficient if the relative attractiveness
          of alternatives is growing faster.
        </p>
      </section>

      <!-- ========== 9. WORKING CONDITIONS ========== -->
      <section>
        <h3>9. Working Conditions</h3>
        <p>
          The attractiveness of the profession is determined not only by income. Simplistically:
        </p>
        \[
          MA = f(\text{Income}, \text{Autonomy}, \text{Conditions}, \text{Prestige},
          \text{Mobility}, \text{Technology}, \text{Training Duration}, \text{Legal Risk},
          \text{Alternatives})
        \]
        <p>
          What is particularly important is that some parameters affect multiple stages
          simultaneously: working conditions → admission → residency → entry into the profession
          → retention.
        </p>
        <p>
          Therefore, improving working conditions may have a greater systemic effect than simply
          increasing the number of budget‑funded places.
        </p>
      </section>

      <!-- ========== 10. MEDICAL DEMAND ========== -->
      <section>
        <h3>10. Medical Demand</h3>
        <p>
          It is also necessary to model the other side of the system:
        </p>
        \[
          H_t = \text{Population}_t \times \text{AgeIntensity}_t \times \text{Morbidity}_t
          \times \text{MedicalIntensity}_t
        \]
        <p>
          where Population — population size; AgeIntensity — intensity of medical care depending on
          age; Morbidity — disease structure; MedicalIntensity — intensity of medical technology use.
        </p>
        <p>
          Therefore, a decline in population does not necessarily mean a decline in demand for
          medical care. Population aging may compensate for or exceed the effect of population decline.
        </p>
      </section>

      <!-- ========== 11. TECHNOLOGY AS MULTIPLIER ========== -->
      <section>
        <h3>11. Technology as a Multiplier of Workforce Capacity</h3>
        <p>
          In the model, technology should not be viewed solely as a way to "replace a physician."
          It is more useful to view it as a multiplier \(EC_t = D_t \times A_t \times P_t\), where
          \(P_t\) can increase through documentation automation, AI, clinical decision support
          systems, telemedicine, automation of routine operations, improved information exchange,
          task redistribution, and digital memory of the medical organization.
        </p>
      </section>

      <!-- ========== 11.5 QUALITY COEFFICIENT ========== -->
      <section>
        <h3>11.5. Quality as a Multiplier</h3>
        <p>
          Increasing the number of physicians does not automatically preserve or improve quality.
          If numerical growth is achieved by lowering admission standards, reducing clinical
          training, or overburdening mentors, the effective capacity may actually decline.
        </p>
        <p>
          Therefore, we introduce a <strong>quality coefficient \(Q_t\)</strong> — the fraction of
          physicians who meet clinical competency standards.
        </p>
        \[
          EC_t = D_t \times A_t \times P_t \times Q_t
        \]
        <p>
          \(Q_t\) can be estimated via certification results, peer reviews, or patient outcomes.
          It ensures that policy makers do not equate "more doctors" with "better care."
        </p>
      </section>

      <!-- ========== 12. DIGITAL MEMORY ========== -->
      <section>
        <h3>12. Digital Memory as an Element of Workforce Sustainability</h3>
        <p>
          If a specialist's practical experience is preserved only in their memory, then the
          specialist's departure leads to a loss of experience. If the experience is structured and
          accessible to the next generation, the specialist's departure leads to partial transfer of
          experience.
        </p>
        <p>
          Therefore:
          \(\text{KnowledgeRetention} \rightarrow \text{Productivity} \rightarrow
          \text{EffectiveCapacity}\).
        </p>
        <p>
          At the same time, digital memory should not replace the physician, clinical guidelines,
          evidence‑based medicine, or medical responsibility. Documented practice must be
          distinguished from proven causal effect.
        </p>
      </section>

      <!-- ========== 13. CONTROLLABLE PARAMETERS ========== -->
      <section>
        <h3>13. Controllable Parameters of the Model</h3>
        <p>
          The main practical purpose of the model is not forecasting for its own sake. It should
          answer the question: which parameter must be changed to obtain a specific result?
        </p>
        <p>Key levers:</p>
        <table>
          <thead>
            <tr>
              <th>Parameter</th>
              <th>What We Change</th>
              <th>Direct Effect</th>
              <th>Delay</th>
              <th>Type</th>
            </tr>
          </thead>
          <tbody>
            <tr><td><strong>N</strong></td><td>number of new physicians</td><td>increases workforce stock</td><td>high</td><td>slow</td></tr>
            <tr><td><strong>R</strong></td><td>retirement age / conditions</td><td>retains physicians</td><td>low–medium</td><td>fast/medium</td></tr>
            <tr><td><strong>L</strong></td><td>departure from profession</td><td>reduces losses</td><td>medium</td><td>medium</td></tr>
            <tr><td><strong>A</strong></td><td>clinical work time share</td><td>increases available capacity</td><td>low</td><td>fast</td></tr>
            <tr><td><strong>P</strong></td><td>productivity</td><td>increases effective capacity</td><td>low–medium</td><td>fast/medium</td></tr>
            <tr><td><strong>C</strong></td><td>medical attractiveness</td><td>increases future inflow</td><td>high</td><td>slow</td></tr>
            <tr><td><strong>OC</strong></td><td>alternative attractiveness</td><td>reduces future inflow</td><td>high</td><td>slow</td></tr>
            <tr><td><strong>K</strong></td><td>knowledge retention</td><td>reduces knowledge loss</td><td>medium</td><td>medium</td></tr>
            <tr><td><strong>I</strong></td><td>immigration</td><td>rapidly increases stock</td><td>low</td><td>fast</td></tr>
            <tr><td><strong>H</strong></td><td>healthcare organization</td><td>changes required capacity</td><td>medium</td><td>medium</td></tr>
            <tr><td><strong>Q</strong></td><td>quality standards</td><td>increases effective capacity</td><td>medium</td><td>medium</td></tr>
          </tbody>
        </table>
        <p>
          Note that \(Q\) is now an explicit lever, reinforcing that quality is not automatic.
        </p>
      </section>

      <!-- ========== 14. USE FOR MANAGEMENT ========== -->
      <section>
        <h3>14. How the Model Can Be Used for Management</h3>
        <p>
          This is a fundamental part of the model. The goal is to turn analysis into a
          decision‑making tool of the form: goal → parameter → magnitude of change → delay →
          expected effect → side effects.
        </p>

        <h4>14.1. Goal 1. Rapidly Increase Available Medical Capacity</h4>
        <p>
          The fastest levers: \(A\uparrow\) and \(P\uparrow\). That is, reducing bureaucracy,
          automating documentation, redistributing tasks, improving scheduling, eliminating
          downtime, digital tools.
        </p>
        <p>
          Advantage: results can appear significantly sooner than a new physician completes training.
        </p>

        <h4>14.2. Goal 2. Reduce Future Workforce Shortages</h4>
        <p>
          The main lever is \(N\uparrow\). But \(N\) can be increased in several ways:
        </p>
        <ul>
          <li>Option A: increase the number of students → effect through the duration of the
            educational cycle;</li>
          <li>Option B: increase the proportion of graduates who continue training (\(O\uparrow\));</li>
          <li>Option C: increase the proportion of graduates who remain in the profession
            (\(Retention\uparrow\)).</li>
        </ul>
        <p>
          In most cases, B and C may be cheaper than endlessly increasing the input flow.
        </p>

        <h4>14.3. Goal 3. Stop Generational Decline</h4>
        <p>
          The main indicator: \(RR = \text{New Physicians} / \text{Departing Physicians}\).
          To achieve \(RR \ge 1\), both sides can be influenced.
        </p>
        <p><strong>Increase the numerator:</strong></p>
        <ul>
          <li>increase input;</li>
          <li>improve residency;</li>
          <li>improve working conditions;</li>
          <li>increase retention of young specialists;</li>
          <li>attract immigration.</li>
        </ul>
        <p><strong>Decrease the denominator:</strong></p>
        <ul>
          <li>make continued work by senior physicians more attractive;</li>
          <li>reduce administrative burden;</li>
          <li>create part‑time employment;</li>
          <li>use the experience of senior physicians as a mentoring resource.</li>
        </ul>
        <p>
          This is far more rational than trying to solve everything solely by increasing enrollment.
        </p>

        <h4>14.4. Goal 4. Reduce Regional Shortages</h4>
        <p>
          Here, changing the national \(D\) may achieve almost nothing. It is necessary to
          influence \(RR\) by region and specialty.
        </p>
        <p>
          Main levers: regional salary, housing, career trajectory, educational infrastructure,
          possibility of returning to a major center after mandatory service, remote support,
          access to expert experience from leading centers.
        </p>
        <p>
          If a physician is in a region but gains access to institutional experience from a leading
          center, the effective capacity of the regional system can grow without the physical
          relocation of the physician.
        </p>

        <h4>14.5. Goal 5. Maintain Quality as the Physician Corps Ages</h4>
        <p>
          Main parameter: \(K = \text{KnowledgeRetention}\). It can be enhanced through mentoring,
          structured experience transfer, digital memory, case‑based learning, documentation of
          complex cases, connecting leading centers with peripheral institutions.
        </p>
        <p>
          Additionally, \(Q\) must be monitored — older physicians may have deep experience but
          also may face cognitive decline or outdated practices. The model should allow for
          differential \(Q\) by age group.
        </p>

        <h4>14.6. Goal 6. Increase Effective Capacity Without Proportional Growth in Numbers</h4>
        <p>
          This is the most technological path: \(P\uparrow\). If the number of physicians is
          unchanged (\(D = const\)), but \(A\uparrow\) or \(P\uparrow\), then \(EC\uparrow\).
        </p>
        <p>
          This is precisely why automation, AI, and work organization improvements should be viewed
          not as a separate digital program, but as part of workforce policy.
        </p>
      </section>

      <!-- ========== 15. SENSITIVITY WITH REALISTIC EXAMPLE ========== -->
      <section>
        <h3>15. Model Sensitivity and a Realistic Example</h3>
        <p>
          For a first approximation, it is convenient to use relative changes. If
          \(EC = D \times A \times P \times Q\), then for small changes:
        </p>
        \[
          \frac{\Delta EC}{EC} \approx \frac{\Delta D}{D} + \frac{\Delta A}{A} + \frac{\Delta P}{P} + \frac{\Delta Q}{Q}
        \]
        <p>
          This means that a 10% increase in effective capacity can be achieved through various
          combinations of smaller improvements.
        </p>

        <h4>Illustrative Example Based on Real Data</h4>
        <p>
          We use data from a photo‑timing study of abdominal surgeons at City Clinical Hospital No. 6
          in Penza (RMANPO, 2024–2026). The study measured actual working time allocation.
        </p>
        <ul>
          <li><strong>Direct patient care (clinical work):</strong> 62.3% for daytime surgeons,
            67.8% for on‑call surgeons.</li>
          <li><strong>Documentation and administrative tasks:</strong> ~9–12%.</li>
          <li><strong>Auxiliary processes (transfers, waiting):</strong> ~18–20%.</li>
        </ul>
        <p>
          For our example, we take a conservative <strong>\(A = 0.62\)</strong> (62% of working time
          spent on direct clinical activity). This is a midpoint between daytime and on‑call values.
          Note that this value applies to <em>this specific group</em>; for other specialties or
          regions, \(A\) may differ significantly (e.g., primary care physicians may have lower
          \(A\) due to higher documentation burden).
        </p>
        <p>
          Assume a department with \(D = 100\) surgeons, \(P = 1.0\) (baseline productivity),
          and \(Q = 1.0\) (all meet quality standards).
        </p>
        <p>
          Current effective capacity:
          \[
            EC = 100 \times 0.62 \times 1.0 \times 1.0 = 62
          \]
        </p>
        <p>
          To increase \(EC\) by 10% (to 68.2), we compare three strategies:
        </p>
        <table>
          <thead>
            <tr><th>Strategy</th><th>Change</th><th>New EC</th><th>Time to effect</th></tr>
          </thead>
          <tbody>
            <tr><td><strong>A</strong> (reduce bureaucracy)</td><td>\(A: 0.62 \to 0.682\)</td><td>68.2</td><td>months</td></tr>
            <tr><td><strong>P</strong> (boost productivity)</td><td>\(P: 1.0 \to 1.1\)</td><td>68.2</td><td>1–3 years</td></tr>
            <tr><td><strong>D</strong> (hire more surgeons)</td><td>\(D: 100 \to 110\)</td><td>68.2</td><td>7+ years</td></tr>
          </tbody>
        </table>
        <p>
          All three yield the same gain, but the time horizons are drastically different.
          A combined approach (\(D+3.3\%,\ A+3.3\%,\ P+3.3\%\)) also gives ~10.2% gain
          (\(1.033^3 \approx 1.102\)) with moderate efforts on each front.
        </p>
        <p>
          <strong>Important caveat:</strong> The \(A=0.62\) value is specific to the studied
          surgeons. In regions with higher administrative burden (as reported by the Audit Chamber,
          up to 50% of working time lost to non‑clinical tasks), \(A\) could be as low as 0.50.
          Therefore, the model must be calibrated locally.
        </p>
        <p>
          Also, the study did not capture 36‑hour on‑call shifts (which exist in practice but were
          not measured). Such extended shifts may reduce effective \(A\) due to fatigue, but they
          are not reflected in the data. This underlines the need for further empirical work.
        </p>
      </section>

      <!-- ========== 16. POLICY APPROACH ========== -->
      <section>
        <h3>16. Why This Changes the Policy Approach</h3>
        <p>
          Suppose it is necessary to increase effective capacity by 15%. There are four
          fundamentally different strategies.
        </p>
        <p>
          <strong>Strategy 1 — education only: \(D +15\%\).</strong> Results appear in years.
        </p>
        <p>
          <strong>Strategy 2 — productivity only: \(P +15\%\).</strong> Results may appear
          significantly faster.
        </p>
        <p>
          <strong>Strategy 3 — work organization: \(A +15\%\).</strong> Part of the effect may be
          achieved even faster.
        </p>
        <p>
          <strong>Strategy 4 — combined: \(D +5\%,\ A +5\%,\ P +5\%\).</strong>
        </p>
        <p>
          In first approximation: \(1.05 \times 1.05 \times 1.05 \approx 1.158\) — that is, about
          15.8% additional effective capacity.
        </p>
        <p>
          This is not a forecast of a specific medical effect. It is a demonstration of the model's
          principle: several moderate changes can yield greater results than attempting to radically
          change a single parameter.
        </p>
      </section>

      <!-- ========== 17. DELAY ========== -->
      <section>
        <h3>17. The Most Important Constraint: Delay</h3>
        <p>Parameters have different speeds of impact.</p>
        <p><strong>Fast:</strong></p>
        <ul>
          <li>work organization;</li>
          <li>reduction of administrative burden;</li>
          <li>automation;</li>
          <li>FTE changes;</li>
          <li>part of immigration decisions.</li>
        </ul>
        <p><strong>Medium:</strong></p>
        <ul>
          <li>physician retention;</li>
          <li>workload redistribution;</li>
          <li>mentoring;</li>
          <li>digital memory.</li>
        </ul>
        <p><strong>Slow:</strong></p>
        <ul>
          <li>change in professional attractiveness;</li>
          <li>change in educational flow;</li>
          <li>training of new specialists;</li>
          <li>demographic structure.</li>
        </ul>
        <p>
          Therefore, a rational strategy must use a portfolio of levers with different time horizons.
        </p>
      </section>

      <!-- ========== 17.5 BUFFER ========== -->
      <section>
        <h3>17.5. Sustainability Buffer</h3>
        <p>
          A simple but powerful derived indicator is the <strong>buffer \(B_t\)</strong>:
        </p>
        \[
          B_t = \frac{D_t - D_{min}}{D_{min}}
        \]
        <p>
          where \(D_{min}\) is the minimum number of physicians required to provide essential care
          (estimated from demand models).
        </p>
        <ul>
          <li>\(B < 0.1\) — the system is in the danger zone;</li>
          <li>\(B < 0\) — critical deficit.</li>
        </ul>
        <p>
          This helps distinguish between "shortage" and "crisis" and provides an early warning
          signal that is easy to communicate.
        </p>
      </section>

      <!-- ========== 18. SCENARIOS ========== -->
      <section>
        <h3>18. Scenarios 2026–2045</h3>
        <p>
          The scenarios presented are purely illustrative and serve to demonstrate the system's
          sensitivity to parameter changes. They are not forecasts and do not claim quantitative
          accuracy.
        </p>
        <p>
          <strong>Scenario A — Demographic Stress.</strong> Assumes a decline in the number of
          young cohorts, high physician workload, continued retirement of older generations, weak
          improvement in conditions, low productivity growth. Result: \(RR < 1\) over a prolonged
          interval. The system enters self‑sustaining deficit.
        </p>
        <p>
          <strong>Scenario B — Inertial.</strong> Gradual increase in training, moderate salary
          increases, moderate digitalization, maintaining the current system structure. Result:
          shortage does not necessarily become catastrophic, but remains chronic. This is the most
          dangerous scenario due to its external appearance of stability.
        </p>
        <p>
          <strong>Scenario C — Improved Attractiveness.</strong> Changes: income↑, autonomy↑,
          conditions↑, administrative burden↓, career flexibility↑. Result appears with delay,
          since first the young person's choice changes, then education, then residency, then entry
          into the profession.
        </p>
        <p>
          <strong>Scenario D — Productivity First.</strong> Physician numbers grow moderately.
          But \(P\uparrow\) through automation, AI, clinical information systems, task
          redistribution, digital memory, process improvement. This scenario allows partial
          compensation of demographic pressure without proportional growth in physician numbers.
        </p>
        <p>
          <strong>Scenario E — Systemic Transformation.</strong> Simultaneously
          \(N\uparrow,\ Retention\uparrow,\ A\uparrow,\ P\uparrow,\ KnowledgeRetention\uparrow\),
          and targeted management of Region × Specialty × Age. This is the most sustainable scenario.
        </p>
      </section>

      <!-- ========== 19. WHAT THE MODEL SHOWS ========== -->
      <section>
        <h3>19. What the Model Should Actually Show Decision‑Makers</h3>
        <p>
          The output should answer not "In 2045 there will be 720 thousand physicians," but:
        </p>
        <ul>
          <li>What medical capacity is needed?</li>
          <li>What capacity will we obtain under current policy?</li>
          <li>Where does the gap arise?</li>
          <li>Which parameter is the main constraint?</li>
          <li>What happens if we change only this parameter?</li>
          <li>In how many years will the effect appear?</li>
          <li>What is the cost of changing the parameter?</li>
          <li>What risks arise when changing it?</li>
        </ul>
        <p>
          This transforms the model from an analytical report into a decision‑making tool.
        </p>
      </section>

      <!-- ========== 20. EARLY WARNING INDICATORS ========== -->
      <section>
        <h3>20. Recommended Early Warning Indicators</h3>
        <p>It is proposed to regularly track:</p>
        <ul>
          <li>Reproduction rate \(RR = \text{New Physicians} / \text{Departing Physicians}\);</li>
          <li>Transition rate from graduates to practice \(TCR\);</li>
          <li>Retention rate \(R_5\);</li>
          <li>Age risk — proportion of physicians above a given threshold;</li>
          <li>Clinical employment share \(A = \text{Clinical time} / \text{Total working time}\);</li>
          <li>Productivity \(P\);</li>
          <li>Quality coefficient \(Q\);</li>
          <li>Buffer \(B\);</li>
          <li>Knowledge loss index — proportion of critical competencies associated with physicians
            approaching retirement;</li>
          <li>Regional \(RR\) for each region‑specialty combination.</li>
        </ul>
      </section>

      <!-- ========== 21. DECISIONS TO COMPARE ========== -->
      <section>
        <h3>21. What Decisions the Model Allows Comparison Of</h3>
        <p>The model should allow questions such as:</p>
        <ul>
          <li>What gives more effect: +10% budget‑funded places or reducing administrative burden by
            10%?</li>
          <li>What is more effective: increasing salary or increasing professional longevity?</li>
          <li>What effect will automating 20% of administrative work have?</li>
          <li>How many additional physicians can we avoid training if productivity grows by 5%?</li>
          <li>Which specialties require enrollment increases, and which primarily require condition
            improvements?</li>
          <li>What happens if the retirement of the older generation accelerates by five years?</li>
          <li>How will the system change if retention of young physicians increases by 10 percentage
            points?</li>
        </ul>
        <p>
          These are precisely the questions that have direct value for state policy.
        </p>
      </section>

      <!-- ========== 22. LIMITATIONS ========== -->
      <section>
        <h3>22. Model Limitations</h3>

        <h4>22.1. "All Models Are Wrong, but Some Are Useful"</h4>
        <p>
          Any model is a simplification of reality. Therefore, "All models are wrong, but some are
          useful" is not a decorative caveat, but a principle for interpreting this document.
        </p>
        <p>
          MWCM should not be used as a machine that produces the "true number of physicians for
          2045." Its purpose is different:
        </p>
        <ul>
          <li>identify dependencies;</li>
          <li>compare scenarios;</li>
          <li>detect sensitive parameters;</li>
          <li>identify early signals;</li>
          <li>assess delays;</li>
          <li>test the robustness of decisions.</li>
        </ul>
        <p>
          If data or assumptions change, the model results should change with them.
        </p>

        <h4>22.2. Data Limitations</h4>
        <p>
          A full‑fledged model requires data not presented in this conceptual document in a unified
          form: physician age, specialty, region, actual FTE, departure from the profession,
          transition between public and private sectors, graduate and resident trajectories, actual
          workload, productivity, medical demand by age groups.
        </p>
        <p>
          Therefore, numerical scenarios should be viewed as sensitivity scenarios, not as an
          official demographic forecast.
        </p>

        <h4>22.3. Causality Limitation</h4>
        <p>
          Correlation does not imply causation. For example, salary growth does not guarantee
          increased enrollment because working conditions, prestige, alternative professions,
          educational requirements, and regional mobility may change simultaneously. Therefore,
          model parameters must be empirically validated.
        </p>

        <h4>22.4. Generality of the Example</h4>
        <p>
          The illustrative example in Section 15 is based on a specific study of abdominal surgeons
          in Penza. It should not be extrapolated to other specialties or regions without local
          calibration. The model is designed to be adaptable, but the numbers are not universal.
        </p>
      </section>

      <!-- ========== 23. AUTHOR'S LIMITATIONS ========== -->
      <section>
        <h3>23. Author's Limitations</h3>
        <p>
          The author is not a physician, health economist, or specialist in Russian healthcare
          organization. Therefore, this document is not an expert medical opinion.
        </p>
        <p>
          Nevertheless, the author has experience directly useful for framing the proposed task.
        </p>
        <p><strong>Author's Strengths</strong></p>
        <p>
          The author has worked for over 15 years as an independent software engineer, involved in
          software systems development, system architecture, R&amp;D, complex system modeling,
          information security, analytical systems construction, information systems integration,
          knowledge management, AI application and automation, and research on the relationship
          between technology and productivity.
        </p>
        <p>
          The author's previous work
          <em>"How many software engineers the economy could support?"</em> addressed a similar
          framing: not simply estimating the number of specialists, but modeling the economic
          capacity of a system to support a certain number of high‑skilled workers, accounting for
          productivity, feedback, implementation time, and other parameters.
        </p>
        <p>
          That work also uses the principle that changing one system parameter can substantially
          change its steady state. This approach is transferred to the present model.
        </p>
        <p><strong>Missing Experience</strong></p>
        <p>
          The author lacks practical experience as a physician, clinical practice, healthcare
          facility management experience, access to restricted healthcare workforce statistics, or
          full‑scale expertise in health economics.
        </p>
        <p>
          Therefore, medical specialists, demographers, health economists, and representatives of
          regional healthcare systems should be considered mandatory participants in the next stage
          of model development.
        </p>
        <p>
          The strength of the present work is the systemic problem framing and model architecture,
          not a claim that the author possesses medical expertise.
        </p>
      </section>

      <!-- ========== 24. RELATED RESEARCH ========== -->
      <section>
        <h3>24. Related Research by the Author</h3>
        <p>
          Below are publications directly related to the methodology and problem framing of the
          present model.
        </p>

        <p>
          <strong>1. How many software engineers the economy could support?</strong><br />
          October 2025. This work is the direct methodological predecessor of the present model.
          It examines base economic capacity, supporting population, productivity, feedback,
          implementation time, success of product creation, exports, automation, and the
          possibility of expanding the natural limit of the system through productivity growth.
        </p>
        <p>
          Link:
          <a href="https://gelassen.github.io/2025/10/09/how-many-sofware-engineers-the-economy-could-support.html">
            https://gelassen.github.io/2025/10/09/how-many-sofware-engineers-the-economy-could-support.html
          </a>
        </p>

        <p>
          <strong>2. Bridging gaps in economy, politics, diplomacy and warfare: review and next steps, Part II</strong><br />
          February 2026. This work describes the development of the author's systems approach to
          complex system analysis: network dependencies, multi‑level causal relationships,
          scenario thinking, and working with uncertainty. These methods are used in the present
          document when constructing the medical workforce reproduction model.
        </p>
        <p>
          Link:
          <a href="https://gelassen.github.io/2026/02/03/bridging-gaps-in-economy-politics-diplomacy-warfare-review-part-II.html">
            https://gelassen.github.io/2026/02/03/bridging-gaps-in-economy-politics-diplomacy-warfare-review-part-II.html
          </a>
        </p>

        <p>
          <strong>3. Digital Memory of Medical Institutions: Turning Clinical Experience into a System Asset</strong><br />
          August 2026. This work examines the creation of digital memory of medical institutions as
          an infrastructure layer that transforms accumulated clinical practice into structured and
          traceable institutional knowledge. In the context of the workforce model, this can be
          viewed as one mechanism: KnowledgeRetention → Productivity → EffectiveCapacity.
        </p>
        <p>
          Link:
          <a href="https://gelassen.github.io/2026/08/18/digital-memory-of-medical-institutions.html">
            https://gelassen.github.io/2026/08/18/digital-memory-of-medical-institutions.html
          </a>
        </p>

        <p>
          This set of publications demonstrates a consistent methodological line: from modeling
          the capacity of a system for high‑skilled human capital — through systems and scenario
          analysis — to applying these methods directly to healthcare and preservation of medical
          experience.
        </p>
        <p>
          It is important to emphasize: medical expertise should come from the Ministry of Health,
          physicians, demographers, and health economists. The author's competence is system
          architecture, modeling, technology, and complex system analysis.
        </p>
      </section>

      <!-- ========== 25. PROPOSED PILOT ========== -->
      <section>
        <h3>25. Proposed Pilot</h3>
        <p>
          To transform the concept into a working tool, it is proposed to begin not by building a
          massive state information system, but with an analytical pilot.
        </p>
        <p><strong>The pilot should include:</strong></p>
        <ul>
          <li>3–5 regions with different demographic situations;</li>
          <li>5–10 specialties;</li>
          <li>several large medical organizations;</li>
          <li>medical universities;</li>
          <li>residency programs;</li>
          <li>data on physician age structure.</li>
        </ul>
        <p>
          It is desirable to reconstruct dynamics for at least 2015–2026 and build scenarios for
          2026–2045.
        </p>
      </section>

      <!-- ========== 26. PROTOTYPE DELIVERABLES ========== -->
      <section>
        <h3>26. What the First Prototype Should Deliver</h3>
        <p>The first prototype should answer at least five questions:</p>
        <ul>
          <li>Where does \(RR < 1\) already exist?</li>
          <li>Which specialties are most sensitive to the departure of the older generation?</li>
          <li>Which regions will be unable to reproduce their own workforce stock?</li>
          <li>Which parameter has the greatest impact on effective capacity?</li>
          <li>Which measures yield results most quickly?</li>
        </ul>

        <h4>Concrete pilot question</h4>
        <p>
          <em>
            "In Sverdlovsk Oblast, for the surgery specialty, 40% of surgeons are older than 55,
            and residency enrollment is only 60% of the target. What is the effect of increasing
            retention of young surgeons by 10 percentage points compared to increasing enrollment
            by 20%?"
          </em>
        </p>
        <p>
          The model should be able to simulate both scenarios and compare them in terms of time,
          cost, and impact on \(RR\) and \(EC\).
        </p>
        <p>
          The pilot is considered successful if it allows ranking 3–5 specific measures by the
          ratio of "effect / lag / cost" for selected specialties and regions.
        </p>
      </section>

      <!-- ========== 27. DESIRED OUTCOME ========== -->
      <section>
        <h3>27. Desired Outcome</h3>
        <p>
          The final result should not be a single number. What is needed is a map of workforce
          sustainability: Region × Specialty × Generation × Scenario.
        </p>
        <p>
          Such a format is far more useful than a single indicator like "Russia is short by N
          physicians."
        </p>
      </section>

      <!-- ========== 28. MAIN CONCLUSION ========== -->
      <section>
        <h3>28. Main Conclusion</h3>
        <p>
          The Russian healthcare workforce problem should be viewed not as a task to
          "train more physicians."
        </p>
        <p>
          A more precise formulation is:
          <em>
            "ensure the reproduction of sufficient effective medical capacity amidst demographic
            changes in the population and physician generations."
          </em>
        </p>
        <p>
          To achieve this, it is necessary to simultaneously manage: quantity + age + specialty +
          geography + retention + conditions + productivity + technology + quality + knowledge.
        </p>
      </section>

      <!-- ========== 29. STRATEGIC PRINCIPLE ========== -->
      <section>
        <h3>29. Strategic Principle</h3>
        <p>
          If a shortage arises today, a solution through increasing student numbers may come too late.
        </p>
        <p>
          If the older generation is retiring today, training a new specialist will not compensate
          for it immediately.
        </p>
        <p>
          If a physician spends a significant portion of working time not on clinical activity,
          increasing headcount may be less effective than eliminating organizational losses.
        </p>
        <p>
          If unique experience disappears with the physician, a new diploma alone is insufficient
          to fully replace the lost capability of the system.
        </p>
        <p>
          Therefore, workforce policy must simultaneously operate on three horizons:
        </p>
        <ul>
          <li>
            <strong>Today:</strong> \(A\uparrow,\ P\uparrow\) — increase the effective capacity
            of the existing corps.
          </li>
          <li>
            <strong>3–7 years:</strong> \(Retention\uparrow,\ KnowledgeRetention\uparrow,\ Q\uparrow\) —
            preserve people, quality, and experience.
          </li>
          <li>
            <strong>7–15+ years:</strong> \(N\uparrow,\ RR \ge 1\) — ensure generational
            reproduction.
          </li>
        </ul>
      </section>

      <!-- ========== 30. CONCLUSION ========== -->
      <section>
        <h3>30. Conclusion</h3>
        <p>
          The most dangerous mistake would be to wait until statistics show an obvious nationwide
          physician shortage. By that time, a significant part of the process will already be
          irreversible: the younger generation will have chosen other professions, the age
          structure of the physician corps will have shifted, specialists will have retired, and
          the educational cycle will no longer allow rapid replenishment of the deficit.
        </p>
        <p>
          Therefore, a transition from reactive workforce policy to an early warning system is
          necessary.
        </p>
        <p>
          The proposed model does not claim to be able to precisely predict the state of Russian
          healthcare in 2045. It proposes something else: to make visible the parameters on which
          that future depends.
        </p>
        <p>
          If the model shows that to achieve a specific goal it is sufficient to change a certain
          parameter by a certain magnitude, this creates a foundation for rational choice between
          alternative state measures.
        </p>
        <p>
          This is precisely why the ultimate goal should not be maximizing the number of physicians.
        </p>
        <p>
          <strong>Goal: maximize sustainable effective medical capacity</strong>
        </p>
        <p>
          while maintaining quality of care, patient safety, professional responsibility of
          physicians, accessibility of care, institutional memory, and the system's ability to
          reproduce itself across generations.
        </p>
        <p>
          It is proposed to consider the Medical Workforce Capacity Model as a conceptual
          foundation for further joint research with medical specialists, demographers, health
          economists, educational organizations, and regional healthcare authorities.
        </p>
      </section>

    </article>
  </body>
</html>]]></content><author><name>Gelassen</name></author><category term="healthcare," /><category term="workforce," /><category term="model," /><category term="demography," /><category term="russia," /><category term="capacity," /><category term="reproduction," /><category term="policy" /><summary type="html"><![CDATA[]]></summary></entry><entry><title type="html">A Memorandum to the World: Technology Must Not Outrun Humanity</title><link href="https://gelassen.github.io/2026/08/18/a-memorandum-to-the-world-technology-must-not-outrun-humanity.html" rel="alternate" type="text/html" title="A Memorandum to the World: Technology Must Not Outrun Humanity" /><published>2026-08-18T00:00:00+00:00</published><updated>2026-08-18T00:00:00+00:00</updated><id>https://gelassen.github.io/2026/08/18/a-memorandum-to-the-world-technology-must-not-outrun-humanity</id><content type="html" xml:base="https://gelassen.github.io/2026/08/18/a-memorandum-to-the-world-technology-must-not-outrun-humanity.html"><![CDATA[<!DOCTYPE html>

<html lang="en">
<head>
    <meta charset="UTF-8">
    <meta name="viewport" content="width=device-width, initial-scale=1.0">

<link rel="stylesheet" href=".css/general.css">

</head>

<body>
<article class="proposal">

<!-- =========================================================
     Introduction
     ========================================================= -->

<section class="proposal-section">
    <h2>A Warning to the World</h2>

    <p>
        I am deeply concerned by the extremely rapid deployment of
        artificial intelligence in the United States and, potentially,
        throughout the world.
    </p>

    <p>
        I am not opposed to artificial intelligence.
    </p>

    <p>
        On the contrary, AI may become a solution to many of humanity's
        most difficult problems. It may accelerate science, medicine,
        education, engineering, and economic development. It may help us
        accomplish things that are currently beyond the capacity of
        individual human beings and institutions.
    </p>

    <p>
        But the same technology may also create new problems —
        sometimes problems far greater than those it was intended to solve.
    </p>

    <p>
        My concern is therefore not that humanity is developing AI.
    </p>

    <p>
        My concern is <strong>how quickly we are doing it, how widely we
        are deploying it, and whether human beings and our institutions
        are developing quickly enough to remain capable of governing what
        we create.</strong>
    </p>

    <p>
        I believe we need to slow down.
    </p>

    <p>
        Not because progress is bad.
    </p>

    <p>
        Because <strong>uncontrolled acceleration increases the
        probability of catastrophic failure.</strong>
    </p>
</section>


<!-- =========================================================
     The Fundamental Problem
     ========================================================= -->

<section class="proposal-section">
    <h2>The Fundamental Problem Is Larger Than Artificial Intelligence</h2>

    <p>
        The problem we are facing is not unique to AI.
    </p>

    <p>
        Throughout modern history, technological power has repeatedly
        increased faster than humanity's ability to understand, regulate,
        and morally govern that power.
    </p>

    <p>
        Technology gives us new capabilities.
    </p>

    <p>
        But capability is not wisdom.
    </p>

    <p>
        Power is not maturity.
    </p>

    <p>
        And intelligence embodied in a machine does not automatically make
        the people operating that machine wiser.
    </p>

    <p>
        There is a fundamental principle that should concern us:
    </p>

    <blockquote>
        <strong>
            The more powerful the tool becomes, the more sophisticated the
            human being and the institutions using it must become.
        </strong>
    </blockquote>

    <p>
        A more complex technology requires a more complex subject capable
        of operating it responsibly.
    </p>

    <p>
        The evolution of technology therefore has to be accompanied by an
        evolution of the human being, culture, ethics, education, law,
        political institutions, and systems of responsibility.
    </p>

    <p>
        The disturbing fact is that this process is not merely lagging
        behind.
    </p>

    <p>
        <strong>It is falling further behind.</strong>
    </p>

    <p>
        We are increasing our technological capabilities faster than we
        are increasing our capacity to use them safely.
    </p>
</section>


<!-- =========================================================
     AI as Cognitive Exoskeleton
     ========================================================= -->

<section class="proposal-section">
    <h2>AI Does Not Replace Thinking — It Amplifies It</h2>

    <p>
        AI should not be understood simply as a replacement for human
        intelligence.
    </p>

    <p>
        It is closer to an <strong>exoskeleton for intelligence and
        thought</strong>.
    </p>

    <p>
        An exoskeleton does not eliminate the importance of the person
        wearing it. It amplifies the person's physical capabilities.
    </p>

    <p>
        AI can do something similar for cognition.
    </p>

    <p>
        It can amplify reasoning, creativity, analysis, memory,
        communication, planning, programming, scientific research,
        and decision-making.
    </p>

    <p>
        But this creates a paradox.
    </p>

    <p>
        If the person operating the system is careless, the system can
        amplify carelessness.
    </p>

    <p>
        If an institution is incompetent, AI can amplify institutional
        incompetence.
    </p>

    <p>
        If a government is reckless, AI can amplify recklessness.
    </p>

    <p>
        If a society is manipulated, AI can make manipulation faster,
        cheaper, more precise, and more scalable.
    </p>

    <p>
        <strong>
            The amplification of intelligence does not automatically mean
            the amplification of wisdom.
        </strong>
    </p>

    <p>
        It may simply mean that whatever is already present in the human
        system becomes more powerful.
    </p>

    <p>
        That is why the question is not only:
    </p>

    <blockquote>
        <em>How intelligent can we make machines?</em>
    </blockquote>

    <p>
        It is also:
    </p>

    <blockquote>
        <strong>
            How intelligent, responsible, disciplined, and morally mature
            must human beings become in order to use them safely?
        </strong>
    </blockquote>
</section>


<!-- =========================================================
     Historical Voices
     ========================================================= -->

<section class="proposal-section">
    <h2>This Warning Is Not New</h2>

    <p>
        I am not the first person to be worried about this.
    </p>

    <p>
        Long before artificial intelligence became a mass technology,
        philosophers, scientists, historians, and technologists were
        already warning that technological power could outrun human
        maturity.
    </p>

    <p>
        Their warnings came from different traditions and different
        historical circumstances.
    </p>

    <p>
        But they repeatedly converged on the same problem:
    </p>

    <blockquote>
        <strong>
            humanity can create more than it can understand, control,
            or morally justify.
        </strong>
    </blockquote>
</section>


<!-- =========================================================
     Ten Voices Before AI
     ========================================================= -->

<section class="proposal-section">
    <h2>Ten Voices Before the Age of Modern AI</h2>

    <div class="proposal-subsection">
        <h3>1. Günther Anders — philosopher</h3>

        <p>
            Anders described what he called <em>Promethean shame</em>:
            the gap between what human beings can manufacture and what
            they are psychologically and morally capable of imagining.
        </p>

        <blockquote>
            “The incapacity of our imagination to grasp the enormity of
            what we can produce.”
        </blockquote>

        <p>
            The warning is remarkably relevant today:
            our technical imagination can become larger than our moral
            imagination.
        </p>
    </div>

    <div class="proposal-subsection">
        <h3>2. Hans Jonas — philosopher</h3>

        <p>
            In <em>The Imperative of Responsibility</em>, Jonas proposed
            a new principle for an age in which human action can affect
            the distant future:
        </p>

        <blockquote>
            “Act so that the effects of your action are compatible with
            the permanence of genuine human life.”
        </blockquote>

        <p>
            This provides one of the clearest foundations for a
            precautionary approach to advanced technology.
        </p>
    </div>

    <div class="proposal-subsection">
        <h3>3. Jacques Ellul — sociologist and philosopher</h3>

        <p>
            Ellul warned that technique could cease to function merely as
            a collection of human tools and become an autonomous system
            whose internal logic increasingly shapes society.
        </p>

        <blockquote>
            “Technique is autonomous.”
        </blockquote>

        <p>
            The question is therefore not only what technology allows us
            to do. It is whether the logic of technological efficiency
            eventually begins determining what we do.
        </p>
    </div>

    <div class="proposal-subsection">
        <h3>4. Lewis Mumford — historian of technology</h3>

        <p>
            Mumford warned against treating technological progress as an
            end in itself. He described the <em>Megamachine</em> —
            the convergence of technological, economic, political, and
            organizational power into systems capable of subordinating
            human purposes to their own logic.
        </p>

        <p>
            His warning was ultimately about what happens when technical
            and organizational power becomes greater than the maturity
            of the institutions directing it.
        </p>
    </div>

    <div class="proposal-subsection">
        <h3>5. Norbert Wiener — founder of cybernetics</h3>

        <p>
            Wiener understood very early that technological progress
            changes not only machines but also the human environment.
        </p>

        <blockquote>
            “We have modified our environment so radically that we must
            now modify ourselves.”
        </blockquote>

        <p>
            If we change the environment of human thought radically enough,
            the human being must adapt as well.
        </p>
    </div>

    <div class="proposal-subsection">
        <h3>6. Erich Fromm — philosopher and social psychologist</h3>

        <p>
            Fromm warned about the transformation of human beings into
            objects within technological and economic systems.
        </p>

        <p>
            His critique of modernity repeatedly returned to alienation
            and the danger of treating the human being as a commodity
            rather than as a person.
        </p>

        <p>
            The lesson for AI is obvious:
            <strong>
                we must not allow efficiency to become a substitute for
                human value.
            </strong>
        </p>
    </div>

    <div class="proposal-subsection">
        <h3>7. Alvin Toffler — futurist</h3>

        <p>
            In <em>Future Shock</em>, Toffler described the psychological
            consequences of “too much change in too short a period of time.”
        </p>

        <p>
            The problem was not technological change itself.
        </p>

        <p>
            It was the velocity of change exceeding the capacity of
            individuals and institutions to adapt.
        </p>

        <p>
            That problem has not disappeared.
            It has become faster.
        </p>
    </div>

    <div class="proposal-subsection">
        <h3>8. Ivan Illich — philosopher</h3>

        <p>
            Illich distinguished between tools that expand human autonomy
            and systems that gradually make human beings dependent upon
            them.
        </p>

        <p>
            His concept of <em>convivial tools</em> was based on the idea
            that tools should remain under meaningful human control.
        </p>

        <p>
            His warning is particularly relevant to AI:
        </p>

        <blockquote>
            <strong>
                A tool should expand human agency, not replace it.
            </strong>
        </blockquote>
    </div>

    <div class="proposal-subsection">
        <h3>9. Karl Popper — philosopher of science</h3>

        <p>
            Popper rejected the idea that society should be redesigned
            according to grand, irreversible plans.
        </p>

        <p>
            His preferred method was <em>piecemeal social engineering</em>:
        </p>

        <blockquote>
            “He will make his way, step by step, carefully comparing the
            results expected with the results achieved.”
        </blockquote>

        <p>
            This is precisely the principle that should govern technologies
            capable of affecting entire societies:
        </p>

        <p class="concept-chain">
            <strong>Experiment → Measure → Learn → Correct → Proceed</strong>
        </p>
    </div>

    <div class="proposal-subsection">
        <h3>10. Zygmunt Bauman — sociologist</h3>

        <p>
            Bauman examined the weakness of human responsibility when
            modern systems combine enormous organizational power with
            technical efficiency.
        </p>

        <p>
            His analysis emphasized the danger created when technology,
            rationalized systems, and economic effectiveness become
            detached from moral responsibility.
        </p>

        <p>
            Technology can make immoral action extraordinarily efficient.
        </p>

        <p>
            That is not a hypothetical problem.
        </p>

        <p>
            Human history has already demonstrated it.
        </p>
    </div>
</section>


<!-- =========================================================
     AI Voices
     ========================================================= -->

<section class="proposal-section">
    <h2>And Now Artificial Intelligence Has Brought the Old Problem to a New Level</h2>

    <p>
        The warnings did not disappear when AI arrived.
    </p>

    <p>
        They became more explicit.
    </p>

    <p>
        And what is particularly significant is <strong>who is making
        them</strong>.
    </p>

    <p>
        These are not warnings coming only from people who oppose
        technology. They include people who helped create the technological
        world we inhabit.
    </p>
</section>


<!-- =========================================================
     Ten AI Voices
     ========================================================= -->

<section class="proposal-section">
    <h2>Ten Voices Specifically Warning About AI</h2>

    <div class="proposal-subsection">
        <h3>1. Bill Joy — co-founder and Chief Scientist of Sun Microsystems</h3>

        <p>
            In 2000, Joy published <em>Why the Future Doesn't Need Us</em>,
            warning that robotics, genetic engineering, and nanotechnology
            could create technologies whose destructive potential exceeded
            our ability to control them.
        </p>

        <blockquote>
            “We must limit development of the technologies that are too dangerous.”
        </blockquote>

        <p>
            Joy's argument was not anti-technology. It was a warning
            against treating technological acceleration as an unquestionable
            good.
        </p>
    </div>

    <div class="proposal-subsection">
        <h3>2. Elon Musk — technology entrepreneur</h3>

        <p>
            Musk has repeatedly warned about AI and called for regulatory
            oversight.
        </p>

        <blockquote>
            “With artificial intelligence we are summoning the demon.”
        </blockquote>

        <p>
            The important part of the warning is not the metaphor.
            It is the underlying question:
        </p>

        <blockquote>
            <strong>
                Can we safely create something whose capabilities may
                eventually exceed our ability to control it?
            </strong>
        </blockquote>
    </div>

    <div class="proposal-subsection">
        <h3>3. Stephen Hawking — theoretical physicist</h3>

        <blockquote>
            “The development of full artificial intelligence could spell
            the end of the human race.”
        </blockquote>

        <p>
            His concern was particularly relevant to the problem of speed:
            technological development can occur much faster than biological
            evolution.
        </p>

        <p>
            Human beings cannot simply evolve cognitively at the same rate
            as our machines.
        </p>
    </div>

    <div class="proposal-subsection">
        <h3>4. Yuval Noah Harari — historian</h3>

        <p>
            Harari has focused on a different danger: not only
            superintelligence, but control over information, narratives,
            institutions, and human relationships.
        </p>

        <blockquote>
            “A social weapon of mass destruction.”
        </blockquote>

        <p>
            He has also argued that AI is the first technology in history
            that can take power away from us.
        </p>

        <p>
            This is a crucial warning because catastrophe does not require
            a machine to become conscious.
        </p>

        <p>
            Human societies can be destabilized long before that.
        </p>
    </div>

    <div class="proposal-subsection">
        <h3>5. Nick Bostrom — philosopher</h3>

        <p>
            Bostrom's central warning is famous:
        </p>

        <blockquote>
            “Machine intelligence is the last invention that humanity will
            ever need to make.”
        </blockquote>

        <p>
            If we create a system capable of outperforming humans across
            intellectual domains, we may also be creating the system that
            designs what comes next.
        </p>

        <p>
            Therefore the transition deserves extraordinary caution.
        </p>
    </div>

    <div class="proposal-subsection">
        <h3>6. Max Tegmark — physicist</h3>

        <p>
            Tegmark helped organize the 2023 open letter calling for a
            pause in the development of increasingly powerful AI systems.
        </p>

        <p>
            The letter warned against an “out-of-control race” to develop
            systems that humans could not reliably understand, predict,
            or control.
        </p>

        <p>
            This is perhaps the most important political problem:
        </p>

        <blockquote>
            <strong>
                Even responsible actors can behave irresponsibly when they
                believe everyone else is accelerating.
            </strong>
        </blockquote>
    </div>

    <div class="proposal-subsection">
        <h3>7. Jaron Lanier — computer scientist and pioneer of virtual reality</h3>

        <p>
            Lanier approaches the issue from the opposite direction.
            Rather than treating AI as an alien intelligence, he argues
            that we should understand it as a human collaboration system.
        </p>

        <p>
            His warning is fundamentally about responsibility:
        </p>

        <blockquote>
            “We can take responsibility.”
        </blockquote>

        <p>
            The danger may be that technology drives society toward mutual
            unintelligibility and collective irrationality.
        </p>

        <p>
            This is an essential correction to the mythology surrounding AI:
        </p>

        <blockquote>
            <strong>
                Machines must never become an excuse for humans to abandon
                responsibility.
            </strong>
        </blockquote>
    </div>

    <div class="proposal-subsection">
        <h3>8. Stuart Russell — AI researcher, University of California, Berkeley</h3>

        <p>
            Russell has been particularly direct about the danger of
            competitive AI development.
        </p>

        <blockquote>
            “Play Russian roulette with every human being on earth.”
        </blockquote>

        <p>
            The underlying argument is that technologies with potentially
            irreversible consequences cannot be governed solely by market
            competition.
        </p>
    </div>

    <div class="proposal-subsection">
        <h3>9. Geoffrey Hinton — pioneer of modern neural networks</h3>

        <p>
            Hinton is perhaps the most significant warning voice precisely
            because he helped create the foundations of modern AI.
        </p>

        <p>
            He has estimated a 10–20% chance of human extinction from AI
            within the next three decades, while emphasizing that the
            number is deeply uncertain.
        </p>

        <blockquote>
            “We've never had to deal with things more intelligent than
            ourselves before.”
        </blockquote>

        <p>
            His warning is therefore not merely about the probability of
            a particular scenario. It is about entering a domain for which
            humanity has no historical precedent.
        </p>
    </div>

    <div class="proposal-subsection">
        <h3>10. Sam Harris — neuroscientist and philosopher</h3>

        <p>
            Harris has argued that the existential-risk scenario should be
            taken seriously enough to justify a pause.
        </p>

        <blockquote>
            “I would definitely pause it.”
        </blockquote>

        <p>
            His position is not that AI can never be useful. It is that
            the alignment and control problem must be understood before
            humanity moves further into territory from which retreat may
            be impossible.
        </p>
    </div>
</section>


<!-- =========================================================
     Common Pattern
     ========================================================= -->

<section class="proposal-section">
    <h2>The Pattern Should Concern Us</h2>

    <p>
        These people disagree enormously.
    </p>

    <p>
        They disagree about AI timelines.
        They disagree about the probability of catastrophe.
        They disagree about whether superintelligence is possible.
        They disagree about whether regulation, alignment research,
        international cooperation, or technological restraint is the
        correct solution.
    </p>

    <p>
        Some are optimists.
    </p>

    <p>
        Some are pessimists.
    </p>

    <p>
        Some are building AI themselves.
    </p>

    <p>
        Some are asking us to stop.
    </p>

    <p>
        But there is one point on which their warnings repeatedly converge:
    </p>

    <blockquote>
        <strong>
            The consequences of advanced technology can become larger than
            the institutions governing it.
        </strong>
    </blockquote>

    <p>
        And that is precisely where caution becomes rational.
    </p>
</section>


<!-- =========================================================
     Irreversibility
     ========================================================= -->

<section class="proposal-section">
    <h2>We Should Not Wait for Catastrophe to Prove That Caution Was Justified</h2>

    <p>
        There is a dangerous asymmetry here.
    </p>

    <p>
        If we slow technological deployment unnecessarily, we lose time.
    </p>

    <p>
        If we accelerate irresponsibly and something catastrophically
        goes wrong, we may lose far more than time.
    </p>

    <p>
        Some consequences may be irreversible.
    </p>

    <p>
        This means the normal logic of technological competition is
        insufficient.
    </p>

    <p>
        In ordinary markets, failure is often survivable.
    </p>

    <ul>
        <li>A company launches a bad product.</li>
        <li>A project fails.</li>
        <li>An investment loses money.</li>
        <li>A competitor overtakes you.</li>
        <li>You learn and try again.</li>
    </ul>

    <p>
        But some technological failures do not provide that luxury.
    </p>

    <p>
        There may be no second attempt.
    </p>

    <p>
        There may be no rollback.
    </p>

    <p>
        There may be no functioning institution left to correct the mistake.
    </p>

    <blockquote>
        <strong>
            When failure can be irreversible, speed must no longer be
            treated as an unquestionable virtue.
        </strong>
    </blockquote>
</section>


<!-- =========================================================
     What I Am Asking
     ========================================================= -->

<section class="proposal-section">
    <h2>What I Am Asking of Those in Power</h2>

    <p>
        I am not calling for the abolition of artificial intelligence.
    </p>

    <p>
        I am calling for <strong>responsible acceleration</strong> —
        progress with brakes, feedback mechanisms, reversibility, and
        institutional preparation.
    </p>

    <div class="proposal-subsection">
        <h3>1. Do not confuse acceleration with progress</h3>

        <p>
            A technology becoming available sooner does not automatically
            mean that humanity is better prepared to use it.
        </p>
    </div>

    <div class="proposal-subsection">
        <h3>2. Introduce powerful systems gradually</h3>

        <p>
            Large-scale deployment should follow controlled stages rather
            than a single irreversible leap.
        </p>
    </div>

    <div class="proposal-subsection">
        <h3>3. Preserve the possibility of retreat</h3>

        <p>
            Critical AI systems should be designed so that society can
            disable, restrict, or replace them.
        </p>

        <p>
            <strong>
                Reversibility should be treated as a design requirement.
            </strong>
        </p>
    </div>

    <div class="proposal-subsection">
        <h3>4. Do not delegate ultimate responsibility to machines</h3>

        <p>
            An AI system can make a recommendation. It can calculate.
            It can analyze. It can assist.
        </p>

        <p>
            But where human lives, fundamental rights, military force,
            critical infrastructure, or civilization-scale decisions are
            concerned, responsibility must remain human.
        </p>
    </div>

    <div class="proposal-subsection">
        <h3>5. Test societal consequences before mass deployment</h3>

        <p>
            Technical benchmarks are not enough.
        </p>

        <p>
            We need social, political, psychological, economic, and
            security benchmarks.
        </p>
    </div>

    <div class="proposal-subsection">
        <h3>6. Do not allow an arms race to determine the speed of civilization</h3>

        <p>
            If every actor accelerates because they fear that someone else
            will accelerate, humanity has created a mechanism in which
            everyone can become trapped into doing what nobody would choose
            independently.
        </p>

        <p>
            This is precisely the kind of problem that requires
            international coordination.
        </p>
    </div>

    <div class="proposal-subsection">
        <h3>7. Invest in the evolution of the human subject</h3>

        <p>
            Education must change.
            Political institutions must change.
            Professional standards must change.
            Ethics must change.
        </p>

        <p>
            People must learn not merely how to use AI, but how to
            <strong>think when AI is available</strong>.
        </p>

        <p>
            The ability to ask a machine for an answer is not the same as
            the ability to understand whether the answer should be trusted.
        </p>
    </div>

    <div class="proposal-subsection">
        <h3>8. Protect human cognitive independence</h3>

        <p>
            If AI becomes an exoskeleton for intelligence, humanity must
            ensure that it does not simultaneously become a prosthesis
            replacing the underlying muscles.
        </p>

        <p>
            A society that can no longer think without its machines is not
            necessarily more intelligent.
        </p>

        <p>
            It may simply be more dependent.
        </p>
    </div>

    <div class="proposal-subsection">
        <h3>9. Create global mechanisms for discussing technological limits</h3>

        <p>
            There are technologies whose consequences are too large to be
            determined solely by individual corporations or individual states.
        </p>

        <p>
            Humanity already understands this principle in relation to
            nuclear weapons, biological weapons, and other civilization-scale
            risks.
        </p>

        <p>
            AI increasingly belongs in the same conversation.
        </p>
    </div>

    <div class="proposal-subsection">
        <h3>10. Adopt the principle of gradualism</h3>

        <p>
            Here Popper's lesson is especially relevant:
        </p>

        <blockquote>
            <strong>
                Proceed step by step, compare expected results with actual
                results, identify unintended consequences, and avoid changes
                whose complexity makes their consequences impossible to
                understand.
            </strong>
        </blockquote>

        <p>
            That is not fear.
        </p>

        <p>
            <strong>That is engineering.</strong>
        </p>
    </div>
</section>


<!-- =========================================================
     The Real Race
     ========================================================= -->

<section class="proposal-section">
    <h2>The Real Race Is Not Between America, China, Europe, or Anyone Else</h2>

    <p>
        The most dangerous framing would be:
    </p>

    <blockquote>
        <em>
            Who will build the most powerful AI first?
        </em>
    </blockquote>

    <p>
        The more important question is:
    </p>

    <blockquote>
        <strong>
            Who will learn how to use powerful AI without losing control
            of themselves?
        </strong>
    </blockquote>

    <p>
        The winner of the technological race should not be the society
        that reaches the most powerful technology first.
    </p>

    <p>
        It should be the society that learns how to combine technological
        power with human maturity.
    </p>

    <p>
        If one country develops powerful AI rapidly while its institutions
        remain immature, it may gain a short-term strategic advantage.
    </p>

    <p>
        But if every major power follows the same logic, the result may be
        a global acceleration in which nobody feels capable of slowing down.
    </p>

    <p>
        That is not progress.
    </p>

    <p>
        <strong>That is a collective failure of coordination.</strong>
    </p>
</section>


<!-- =========================================================
     Final Warning
     ========================================================= -->

<section class="proposal-section">
    <h2>A Final Warning</h2>

    <p>
        We should remember that the greatest danger of technology may not
        be that machines become too intelligent.
    </p>

    <p>
        It may be that
        <strong>
            human beings become too powerful without becoming sufficiently wise.
        </strong>
    </p>

    <p>
        We have already seen this pattern.
    </p>

    <p>
        We developed technologies capable of destroying cities before
        developing political institutions capable of eliminating war.
    </p>

    <p>
        We developed industrial technologies capable of transforming the
        planet before fully understanding their ecological consequences.
    </p>

    <p>
        We developed global communications before developing sufficient
        cultural mechanisms for resisting mass manipulation.
    </p>

    <p>
        And now we are developing systems capable of amplifying human
        intelligence itself.
    </p>

    <p>
        The scale of the next transformation may therefore be unprecedented.
    </p>

    <p>
        We should not assume that because we created the technology, we
        automatically understand its consequences.
    </p>

    <p>
        We should not assume that because we can build something, we are
        ready to deploy it everywhere.
    </p>

    <p>
        We should not assume that because a technology can solve one
        problem, it cannot create another — perhaps larger — problem.
    </p>

    <p>
        And above all, we should not allow
        <strong>
            the speed of technological development to become faster than
            the speed at which humanity can learn to govern it.
        </strong>
    </p>
</section>


<!-- =========================================================
     Central Principle
     ========================================================= -->

<section class="proposal-section">
    <h2>The Principle</h2>

    <p>
        I would therefore formulate the central principle of this
        memorandum as simply as possible:
    </p>

    <blockquote class="principle-quote">
        <strong>
            Technology must not outrun humanity.
        </strong>
    </blockquote>

    <p>
        And for artificial intelligence:
    </p>

    <blockquote class="principle-quote">
        <strong>
            The development of machine intelligence must be accompanied
            by the development of human intelligence, human responsibility,
            and the institutions capable of controlling the power we are creating.
        </strong>
    </blockquote>

    <p>
        We do not need to stop progress.
    </p>

    <p>
        We need to make progress <strong>survivable</strong>.
    </p>

    <p>
        We do not need to fear intelligence.
    </p>

    <p>
        We need to make sure that intelligence — human and artificial —
        remains connected to responsibility.
    </p>

    <p>
        We do not need to reject the future.
    </p>

    <p>
        We need to make sure that we are mature enough to enter it.
    </p>

    <p class="concept-chain">
        <strong>
            Slow down where the consequences may be irreversible.<br>
            Experiment where the consequences can be contained.<br>
            Measure what happens.<br>
            Learn.<br>
            Adapt.<br>
            Then proceed.
        </strong>
    </p>

    <p>
        The future does not belong to those who accelerate the fastest.
    </p>

    <p>
        It belongs to those who can move forward
        <strong>
            without losing control of the direction in which they are going.
        </strong>
    </p>
</section>


<!-- =========================================================
     Note on Quotations
     ========================================================= -->

<section class="proposal-section">
    <h2>A Note on the Quotations</h2>

    <p>
        The quotations above have deliberately been kept short and
        traceable. Several formulations commonly circulated online and
        presented as direct quotations from Anders, Jonas, Wiener, Popper,
        and others are actually paraphrases or translations of longer
        arguments.
    </p>

    <p>
        For a public memorandum, it is more responsible to use short
        quotations and distinguish them from the author's own formulation.
    </p>

    <p>
        The intellectual lineage is therefore not being presented as
        evidence that all these thinkers agreed with one another.
        They did not.
    </p>

    <p>
        It is being presented for a different reason:
    </p>

    <blockquote>
        <strong>
            The question of whether technological power can outrun human
            maturity is much older than artificial intelligence.
        </strong>
    </blockquote>

    <p>
        AI has not invented this problem.
    </p>

    <p>
        <strong>
            It has made the problem considerably more urgent.
        </strong>
    </p>
</section>

</article>
</body>
</html>]]></content><author><name>Gelassen</name></author><summary type="html"><![CDATA[]]></summary></entry><entry><title type="html">Digital Memory of Medical Institutions: Turning Clinical Experience into a System Asset</title><link href="https://gelassen.github.io/2026/08/18/digital-memory-of-medical-institutions.html" rel="alternate" type="text/html" title="Digital Memory of Medical Institutions: Turning Clinical Experience into a System Asset" /><published>2026-08-18T00:00:00+00:00</published><updated>2026-08-18T00:00:00+00:00</updated><id>https://gelassen.github.io/2026/08/18/digital-memory-of-medical-institutions</id><content type="html" xml:base="https://gelassen.github.io/2026/08/18/digital-memory-of-medical-institutions.html"><![CDATA[<!DOCTYPE html>

<html lang="en"> <head> <meta charset="UTF-8"> <meta name="viewport" content="width=device-width, initial-scale=1.0">

<link rel="stylesheet" href=".css/general.css">

</head>

<body> <article class="proposal">

<!-- =========================================================
     Executive Summary
     ========================================================= -->

<section class="proposal-section">
    <h2>Executive Summary</h2>

    <p>
        Artificial Intelligence is no longer a peripheral technology.
        It has the potential to become a next driver of industrial revolution.
        Using AI is rapidly shifting from “nice to have” to “must have”:
        it will increasingly differentiate competitive products and services
        from ineffective ones. Therefore applying AI thoughtfully to government
        work is essential — just as it is essential for the economy and other
        critical domains.
    </p>

    <p>
        Earlier work established the broader strategic frame.
        In
        <a href="https://gelassen.github.io/2026/06/19/artificial-intelligence-in-education-and-management.html"
           target="_blank"
           rel="noopener noreferrer">
            Artificial Intelligence in Education and Management
        </a>
        the central thesis was formulated: AI has already ceased to be merely
        an auxiliary tool and is becoming a factor of productivity,
        competitiveness, organisational and governmental management,
        and labour-market structure. The same analysis underlined the systemic
        risks that accompany uncontrolled adoption and the necessity of
        controlled, human-centred deployment.
    </p>

    <p>
        Subsequent research in manufacturing revealed a concrete missing piece.
        The analysis
        <a href="https://gelassen.github.io/2026/07/28/production-knowledge-as-foundation-for-ai-in-industry.html"
           target="_blank"
           rel="noopener noreferrer">
            Production Knowledge as the Foundation for AI in Industry
        </a>
        showed that the majority of recurring operational problems are not
        caused by the absence of modern AI models. They are caused by the
        absence of an effective system for capturing, storing, searching and
        reusing production knowledge — the digital memory of the enterprise.
        Without structured accumulated experience, AI has less reliable
        organisational knowledge to work with.
    </p>

    <p>
        Healthcare exhibits a strikingly similar pattern, amplified by
        additional domain-specific blockers.
    </p>

    <p>
        Russian healthcare already stores vast volumes of medical information.
        EGISZ, REMD, regional systems and local MIS successfully answer one
        important question:
    </p>

    <p>
        <strong>“What data exists about this patient?”</strong>
    </p>

    <p>
        They can also contain information about clinical decisions, treatments
        and subsequent events. However, the existence of these records does
        not automatically turn them into reusable institutional clinical
        experience.
    </p>

    <p>
        This leads to a second, equally important question:
    </p>

    <p>
        <strong>
            “What was done in similar documented cases — and what happened afterwards?”
        </strong>
    </p>

    <p>
        Today, the answer to this question is often difficult to obtain
        systematically. Clinical experience remains distributed across
        institutions, systems and documents. Similar cases may be rediscovered
        repeatedly. Valuable experience accumulated in one medical institution
        may remain difficult to reuse elsewhere. When an experienced specialist
        leaves, part of the institution’s practical memory may also become
        difficult to recover and transfer.
    </p>

    <p>
        The missing capability is therefore not simply another repository of
        medical data.
    </p>

    <p>
        It is the ability to
        <strong>
            turn accumulated medical records and documented clinical decisions
            into reusable institutional knowledge
        </strong>.
    </p>

    <p>
        These three lines of work converge on a single practical proposal
        for the government healthcare system: create a missing infrastructure
        layer — a
        <strong>Digital Memory of Medical Institutions</strong>.
    </p>

    <p>
        It sits on top of the existing digital infrastructure. It does not
        replace EGISZ, clinical guidelines, MIS or the physician. Data
        standardisation, integration and aggregation from existing systems
        are necessary technical prerequisites, but they are not the primary
        goal.
    </p>

    <p>
        The primary goal is to transform documented clinical practice into a
        <strong>
            structured, reusable and traceable body of institutional clinical
            experience
        </strong>.
    </p>

    <p>
        The core idea is simple:
    </p>

    <blockquote>
        <strong>
            Existing medical documents should become raw material for
            institutional clinical memory, not the final product of the system.
        </strong>
    </blockquote>

    <p>
        Such a system should not merely provide a recommendation such as:
    </p>

    <blockquote>
        “In similar cases, X was recommended.”
    </blockquote>

    <p>
        It should make it possible to trace that recommendation back to the
        documented cases, clinical decisions and outcomes from which the
        institutional knowledge was derived.
    </p>

    <p>
        This is an important distinction from a conventional generative AI
        assistant. The value is not only in producing a plausible answer,
        but in making its institutional basis inspectable.
    </p>

    <p>
        <strong>
            The system should not ask a physician simply to trust an AI-generated
            conclusion. It should allow the physician to understand and verify
            why that conclusion was reached.
        </strong>
    </p>

    <p>
        Recent practical work on a university BI system demonstrated how such
        decision-support infrastructure can be built with explicit traceability,
        alternative interpretations, confidence levels and known limitations.
        In
        <a href="https://gelassen.github.io/2026/07/11/bi-system-for-university-part-I.html"
           target="_blank"
           rel="noopener noreferrer">
            Lightweight BI system for university, part I
        </a>
        the architecture deliberately separates observations from conclusions
        and keeps the human expert as the final decision maker — principles
        that transfer directly to clinical settings.
    </p>

    <p>
        A Digital Memory of Medical Institutions could therefore provide
        healthcare with a capability that existing information systems do not
        fully provide: the ability to
        <strong>
            learn systematically from its own documented clinical practice
        </strong>.
    </p>

    <p>
        This could reduce dependence on the physical location of expertise,
        preserve institutional knowledge, reduce repeated rediscovery of
        similar clinical approaches, and create a durable knowledge asset
        from experience that is already being accumulated by the healthcare
        system.
    </p>

    <p>
        All of the above opens significant opportunities as well as new risks.
        Clinical data is highly sensitive, historical experience may contain
        errors or local biases, and inappropriate generalisation from previous
        cases can be dangerous. Privacy, security, access control, clinical
        validation, legal responsibility and governance must therefore be
        considered integral parts of such a system.
    </p>

    <p>
        This is a conceptual proposal and only the beginning of a much larger
        path towards implementing such an innovation. Many technical, clinical,
        organisational, legal, ethical and security challenges remain to be
        discovered, understood and overcome. The purpose of this proposal is
        not to claim that all of these questions have already been solved, but
        to define a potentially valuable direction for further work.
    </p>

    <p>
        This proposal has been prepared for the
        <strong>Ministry of Health of the Russian Federation</strong>
        as a conceptual starting point for discussion and further investigation.
    </p>
</section>


<!-- =========================================================
     The Problem
     ========================================================= -->

<section class="proposal-section">
    <h2>The Problem: Data Without Memory</h2>

    <p>
        Healthcare systems excel at recording events. They are far weaker
        at turning those events into transferable institutional knowledge.
    </p>

    <p>
        Today clinical experience is fragmented across:
    </p>

    <ul>
        <li>individual physicians,</li>
        <li>separate institutions,</li>
        <li>incompatible MIS,</li>
        <li>paper notes and informal conversations.</li>
    </ul>

    <p>
        Consequences are concrete:
    </p>

    <ul>
        <li>
            A primary-care doctor rarely sees the full documented decision
            path and subsequent outcomes from a specialised centre.
        </li>
        <li>
            Similar complex cases are solved from scratch instead of building
            on previous documented results.
        </li>
        <li>
            Data exchanged between organisations often arrives in a form
            that is hard to analyse or reuse.
        </li>
        <li>
            Every new MIS integration is custom and expensive.
        </li>
        <li>
            When a key specialist retires or moves, a significant part of
            hard-won practical knowledge may become difficult to recover
            and transfer.
        </li>
    </ul>

    <p>
        The system records clinical events and documents. It does not
        systematically transform those records into a reusable memory of
        <em>
            what happened after particular clinical decisions in comparable cases
        </em>.
    </p>
</section>


<!-- =========================================================
     Proposed Solution
     ========================================================= -->

<section class="proposal-section">
    <h2>Proposed Solution: Three Linked Functions</h2>

    <div class="proposal-subsection">
        <h3>1. Capture experience as structured clinical cases</h3>

        <p>
            Every case is represented as a linked chain:
        </p>

        <p class="concept-chain">
            <strong>Observations → Decision → Treatment → Outcome</strong>
        </p>

        <p>
            Context, data limitations and confidence level are preserved.
            The result is not another free-text note, but a reusable clinical
            case that can be compared, searched and explained.
        </p>

        <p>
            An important distinction must be preserved throughout the process:
            documented clinical facts are not the same as reconstructed clinical
            reasoning. Where the reasoning behind a decision is inferred from
            available documentation, the system should explicitly identify it
            as reconstructed rather than presenting it as an observed fact.
        </p>
    </div>

    <div class="proposal-subsection">
        <h3>2. Make experience available to the treating physician</h3>

        <p>
            When a doctor works with a new patient, the system surfaces similar
            historical cases and shows:
        </p>

        <ul>
            <li>decisions that were made,</li>
            <li>treatment options that were applied,</li>
            <li>observed outcomes,</li>
            <li>degree of similarity and the factors contributing to it,</li>
            <li>alternative hypotheses that were considered,</li>
            <li>known limitations of the recommendation.</li>
        </ul>

        <p>
            Similarity itself is not a guarantee of clinical equivalence.
            The system should therefore make clear why historical cases were
            considered similar, what relevant information is missing, and how
            strong the resulting evidence is.
        </p>

        <p>
            This is not a black-box answer. It is traceable decision support
            grounded in documented real practice, with explicit boundaries
            on what can and cannot be inferred from that practice.
        </p>

        <p>
            In particular, an observed association between a treatment and
            a favourable outcome in historical cases should not automatically
            be interpreted as proof that the treatment caused the outcome.
            Differences in patient characteristics, disease severity, selection
            of treatment, physician expertise and other factors may influence
            observed results.
        </p>
    </div>

    <div class="proposal-subsection">
        <h3>3. Create a single integration hub</h3>

        <p>
            MIS no longer need to build point-to-point integrations with every
            other system. They connect once to a common interface and use a
            shared clinical-case format. The Digital Memory becomes both a
            working tool for physicians and a practical standardisation point
            for the exchange of clinical experience.
        </p>

        <p>
            Such an interface requires not only technical interoperability
            but also semantic standardisation: common definitions, terminology,
            identifiers, units, classifications and rules for representing
            the meaning and provenance of clinical information. A common API
            alone is not sufficient if connected systems interpret the same
            data differently.
        </p>
    </div>
</section>


<!-- =========================================================
     Positioning
     ========================================================= -->

<section class="proposal-section">
    <h2>Positioning: The Missing Layer</h2>

    <p>
        Existing classes of solutions solve important but different problems.
        They may overlap with some functions described here, but they are not
        primarily designed to provide a persistent, cross-institutional memory
        of documented clinical experience and observed outcomes as a day-to-day
        working layer for physicians:
    </p>

    <div class="table-wrapper">
        <table class="comparison-table">
            <thead>
                <tr>
                    <th scope="col">Class of solutions</th>
                    <th scope="col">What they give the physician</th>
                    <th scope="col">
                        What they typically do not provide as their primary function
                    </th>
                </tr>
            </thead>

            <tbody>
                <tr>
                    <td>
                        Clinical decision support &amp; predictive analytics
                        (Webbiomed, MosMedAI and similar)
                    </td>
                    <td>
                        Risk scores, preliminary diagnoses, EMR analysis
                    </td>
                    <td>
                        Persistent shared memory of documented real cases with
                        outcomes across institutions
                    </td>
                </tr>

                <tr>
                    <td>
                        Evidence engines
                        (UpToDate, DynaMed, ClinicalKey, OpenEvidence)
                    </td>
                    <td>
                        Access to guidelines and scientific literature
                    </td>
                    <td>
                        Systematic reuse of the healthcare system’s own
                        accumulated clinical experience
                    </td>
                </tr>

                <tr>
                    <td>Medical AI search tools</td>
                    <td>
                        Fast retrieval of normative and clinical sources
                    </td>
                    <td>
                        Systematic accumulation and reuse of real-world
                        institutional outcomes
                    </td>
                </tr>

                <tr>
                    <td>EHR-native solutions</td>
                    <td>
                        Support inside one MIS or hospital network
                    </td>
                    <td>
                        A cross-system clinical memory layer spanning
                        participating institutions
                    </td>
                </tr>

                <tr>
                    <td>Federated learning / research platforms</td>
                    <td>
                        Ability to train models without moving raw data
                    </td>
                    <td>
                        A mass-scale, day-to-day working tool for practising
                        physicians that exposes comparable historical cases
                        and their documented outcomes
                    </td>
                </tr>
            </tbody>
        </table>
    </div>

    <p>
        <strong>Our niche is different.</strong>
    </p>

    <p>
        This is not “another medical AI”. It is infrastructure for the
        accumulation and reuse of clinical experience.
    </p>

    <p>
        The market today mostly answers:
    </p>

    <p>
        <strong>“What does medicine recommend?”</strong>
    </p>

    <p>
        The proposed system adds a second, equally necessary question:
    </p>

    <p>
        <strong>
            “What actually happened in real similar documented cases — and what was the result?”
        </strong>
    </p>

    <p>
        The combination of evidence-based knowledge and real-world clinical
        memory can become a foundation for the next generation of physician
        decision support. The two sources of knowledge should complement each
        other rather than be treated as interchangeable: evidence describes
        what is supported by research and established medical knowledge, while
        clinical memory describes what has been observed in the participating
        healthcare system.
    </p>
</section>


<!-- =========================================================
     Value
     ========================================================= -->

<section class="proposal-section">
    <h2>Value for the Healthcare System</h2>

    <div class="proposal-subsection">
        <h3>For the physician</h3>

        <ul>
            <li>Faster orientation in complex cases.</li>
            <li>
                Access to the experience of leading centres without leaving
                the working MIS.
            </li>
            <li>
                Transparent recommendations: the doctor sees the supporting
                cases, confidence and limitations.
            </li>
        </ul>
    </div>

    <div class="proposal-subsection">
        <h3>For the system</h3>

        <ul>
            <li>
                Clinical experience becomes a systemic asset instead of
                personal knowledge that walks out the door.
            </li>
            <li>
                Quality of care can become less dependent on the particular
                institution a patient happens to reach.
            </li>
            <li>
                A single interface creates a practical standardisation point
                for different MIS.
            </li>
        </ul>
    </div>

    <div class="principle">
        <h3>Core principle</h3>

        <p>
            Final clinical responsibility always remains with the physician.
        </p>

        <p>
            The system must show not only a conclusion, but the evidence
            it rests on and the boundaries of its applicability.
        </p>
    </div>
</section>


<!-- =========================================================
     Pilot
     ========================================================= -->

<section class="proposal-section">
    <h2>Pilot Proposal: Start Where Experience Matters Most</h2>

    <p>
        We propose to begin with <strong>neurology</strong> — a domain in
        which differential diagnosis is complex, accumulated expert experience
        is especially valuable, and access to specialised centres is uneven.
    </p>

    <div class="proposal-subsection">
        <h3>Pilot contour</h3>

        <ul>
            <li>
                1–2 large neurological centres → sources of expert clinical experience
            </li>
            <li>
                Several primary-care and inpatient institutions → users of the system
            </li>
            <li>
                1–2 MIS vendors → validation of the standard connection model
            </li>
        </ul>
    </div>

    <div class="proposal-subsection">
        <h3>What the pilot must verify</h3>

        <ul>
            <li>
                <strong>Value</strong> — Does search time for analogous cases
                and tactical decision-making decrease?
            </li>
            <li>
                <strong>Quality</strong> — Are real cases, decisions, relevant
                context and outcomes structured completely and correctly enough?
            </li>
            <li>
                <strong>Trust</strong> — Do physicians find the recommendations
                useful, understandable and verifiable?
            </li>
            <li>
                <strong>Integration</strong> — Can an external MIS connect
                to a single interface without a custom bilateral integration
                while preserving semantic consistency?
            </li>
            <li>
                <strong>Safety</strong> — Does the de-identification,
                access-control, traceability and recommendation-limitation
                model work in a closed or federated environment?
            </li>
            <li>
                <strong>Evidence quality</strong> — Can the system distinguish
                documented observations from reconstructed reasoning and observed
                associations from conclusions that would require causal evidence?
            </li>
            <li>
                <strong>Privacy</strong> — Can sufficient clinical context
                be preserved for useful case comparison without creating
                unacceptable re-identification risks?
            </li>
        </ul>
    </div>
</section>


<!-- =========================================================
     Roadmap
     ========================================================= -->

<section class="proposal-section">
    <h2>Roadmap</h2>

    <ol>
        <li>
            Discuss the concept with the relevant departments of the Ministry
            of Health of Russia and interested National Medical Research Centres.
        </li>

        <li>
            Form a working group (clinicians, digitalisation specialists,
            legal experts, information-security specialists, data architects
            and MIS developers).
        </li>

        <li>
            Develop a minimal clinical-case standard, semantic model and the
            technical assignment for the pilot.
        </li>

        <li>
            Define governance, access-control, privacy, provenance and
            clinical-safety requirements before connecting real clinical data.
        </li>

        <li>
            Launch a limited pilot and evaluate it against pre-agreed metrics.
        </li>

        <li>
            If the hypothesis is confirmed — define the path to scaling,
            federated connection of regions, and further standardisation
            of clinical-experience exchange.
        </li>
    </ol>
</section>


<!-- =========================================================
     Closing Thought
     ========================================================= -->

<section class="proposal-section">
    <h2>Closing Thought</h2>

    <p>
        EGISZ already helps the healthcare system remember which documents
        were created and which information was recorded.
    </p>

    <p>
        The next step is to help the system systematically transform
        documented clinical practice into reusable experience: what was
        observed, which decisions were made, what treatment followed,
        and what outcomes were subsequently observed.
    </p>

    <p>
        Digital Memory of Medical Institutions is a proposal to build exactly
        that layer — an infrastructure of reusable clinical experience that
        can raise the quality of care, reduce dependence on individual
        specialists, and make the collective knowledge of Russian medicine
        more accessible to every authorised physician who needs it.
    </p>

    <p>
        This proposal is intentionally conceptual. It is not a claim that
        the complete technical, clinical, legal or organisational solution
        has already been designed. It is the beginning of a much larger
        journey towards implementing an innovation of this scale. Many
        challenges will only become visible through practical work, and
        they will have to be discovered, tested and overcome step by step.
    </p>

    <p>
        The objective of the proposal is therefore not to replace clinical
        judgement or established medical science, but to create the
        infrastructure through which the healthcare system can learn more
        systematically from its own documented experience while preserving
        evidence, uncertainty, provenance and human responsibility.
    </p>
</section>


<!-- =========================================================
     Related Publications
     ========================================================= -->

<section class="proposal-section related-publications">
    <h2>Related Publications</h2>

    <ul>
        <li>
            <a href="https://gelassen.github.io/2026/07/11/bi-system-for-university-part-I.html"
               target="_blank"
               rel="noopener noreferrer">
                Lightweight BI system for university, part I
            </a>
        </li>

        <li>
            <a href="https://gelassen.github.io/2026/07/02/artificial-intelligence-applied-to-the-government.html"
               target="_blank"
               rel="noopener noreferrer">
                AI applied to the Government: Transforming Public Administration
                into a Self-Learning System
            </a>
        </li>

        <li>
            <a href="https://gelassen.github.io/2026/07/28/production-knowledge-as-foundation-for-ai-in-industry.html"
               target="_blank"
               rel="noopener noreferrer">
                Production Knowledge as the Foundation for AI in Manufacturing Industry
            </a>
        </li>
    </ul>
</section>

</article> </body> </html>]]></content><author><name>Gelassen</name></author><summary type="html"><![CDATA[]]></summary></entry><entry><title type="html">Production Knowledge as the Foundation for AI in Manufacturing Industry</title><link href="https://gelassen.github.io/2026/07/28/production-knowledge-as-foundation-for-ai-in-industry.html" rel="alternate" type="text/html" title="Production Knowledge as the Foundation for AI in Manufacturing Industry" /><published>2026-07-28T00:00:00+00:00</published><updated>2026-07-28T00:00:00+00:00</updated><id>https://gelassen.github.io/2026/07/28/production-knowledge-as-foundation-for-ai-in-industry</id><content type="html" xml:base="https://gelassen.github.io/2026/07/28/production-knowledge-as-foundation-for-ai-in-industry.html"><![CDATA[<!DOCTYPE html>
<html lang="en">
<head>
<meta charset="UTF-8">
<meta name="viewport" content="width=device-width, initial-scale=1.0">
<link rel="stylesheet" href=".css/general.css">
</head>
<body>
<article>
<section>
<h3>Executive Summary</h3>
<p>
        Most discussions about Artificial Intelligence in manufacturing start with technology:
        large language models, computer vision, predictive analytics, or digital twins.
        The usual sequence is familiar — first choose a technology, then look for problems it might solve.
</p>
<p>
        This analysis takes the opposite approach.
</p>
<p>
        It starts with real production problems observed across Russian and international manufacturing enterprises.
        Only after identifying the most persistent and costly problems does it examine where digital tools and AI can actually help.
</p>
<p>
        The central finding is straightforward:
</p>
<blockquote>
        The majority of recurring operational problems in manufacturing are not caused by the absence of modern AI models.
        They are caused by the absence of an effective system for capturing, storing, searching, and reusing production knowledge —
        what can be called the digital memory of the enterprise.
</blockquote>
<p>
        The working hypothesis is therefore:
</p>
<p>
        <strong>The primary constraint on effective AI adoption in industry today is not the maturity of the models themselves,
        but the lack of high-quality, structured, and accumulated production knowledge.
        AI can significantly improve operational efficiency only when it has something real to work with.</strong>
</p>
<p>
        Recommended sequence:
</p>
<ul>
<li>Build a unified digital knowledge base (the enterprise’s digital memory).</li>
<li>Establish reliable data accumulation and documentation practices.</li>
<li>Deploy intelligent services on top of that foundation (semantic search, recurring failure analysis, recommendations, automated documentation, prediction).</li>
</ul>
<p>
        This post is a preliminary analysis based on open sources.
        The hypothesis requires field verification through interviews on actual production sites.
</p>
        <p>
                A whole document is available by <a href="/assets/docs/2026-07-28/Proizvodstvennye_znaniya_kak_fundament_II_v5.docx.pdf">link</a>        
        </p>
</section>

<section>
<h3>Why a Roadmap for AI Cannot Start with Technology</h3>
<p>
        A serious roadmap for AI in manufacturing should not begin with model selection, platforms, or infrastructure.
</p>
<p>
        It should begin with a more fundamental question:
</p>
<p>
        <strong>Which production problems actually need to be solved?</strong>
</p>
<p>
        Skipping this step produces collections of fashionable digital initiatives that have little measurable impact on productivity.
</p>
<p>
        The principle used here is simple:
</p>
<blockquote>
        First — real production problems.
        Then — analysis of their causes.
        Then — evaluation of existing digital tools.
        Only then — the role of Artificial Intelligence.
</blockquote>
<p>
        This is the approach used by leading industrial research centres and is the only reliable way to avoid technology for technology’s sake.
</p>
</section>

<section>
<h3>Methodology</h3>
<h4>Sources and priorities</h4>
<p>
        The analysis prioritised materials closest to primary sources:
</p>
<table>
<thead>
<tr>
<th>Priority</th>
<th>Source</th>
</tr>
</thead>
<tbody>
<tr>
<td>A</td>
<td>Interviews with engineers, maintenance technicians, shift supervisors, process engineers, production managers</td>
</tr>
<tr>
<td>A</td>
<td>Government productivity studies</td>
</tr>
<tr>
<td>B</td>
<td>Academic papers based on shop-floor interviews</td>
</tr>
<tr>
<td>B</td>
<td>Industry association materials</td>
</tr>
<tr>
<td>C</td>
<td>Company annual reports and conference materials</td>
</tr>
<tr>
<td>D</td>
<td>Consulting reports</td>
</tr>
<tr>
<td>E</td>
<td>Press releases</td>
</tr>
</tbody>
</table>
<p>
        The review covered Russian enterprises as well as material from Germany, the United States, Japan, China,
        Fraunhofer studies, ethnographic research of production processes, and maintenance organisation literature.
</p>
<p>
        The goal was not statistical representativeness, but identification of patterns that appear independently
        of country, industry, and level of digitalisation.
</p>

<h4>Use of AI tools</h4>
<p>
        Modern AI tools were used for search, aggregation, structuring, and preliminary analysis of open sources.
        This expanded the volume of material examined and accelerated pattern detection.
</p>
<p>
        At the same time, the limitations are clear: possible incomplete sampling, interpretation errors,
        data quality issues, and publication bias. All conclusions remain preliminary working hypotheses
        that require verification through direct interviews on industrial sites.
</p>

<h4>Research limitations</h4>
<p>
        A full AI roadmap cannot be built from internet sources alone. Field research is required.
</p>
<p>
        A minimally representative sample would include at least ten enterprises from one industry,
        with interviews across the full range of roles: machine operators, maintenance engineers, repair teams,
        shift supervisors, process engineers, quality specialists, IT staff, production managers, and plant leadership.
</p>
<p>
        Only such a sample can reliably identify systemic problems, quantify economic impact,
        and determine which digitalisation directions deliver the highest return.
</p>
</section>

<section>
<h3>Map of Recurring Production Problems</h3>
<p>
        Despite large differences in countries, automation levels, and IT landscapes,
        the most frequently reported problems show a striking degree of consistency.
        Most of them have little to do with the absence of AI.
</p>

<h4>Workforce-related</h4>
<ul>
<li>Loss of production knowledge when experienced employees leave or retire</li>
<li>Shortage of qualified specialists</li>
<li>Long onboarding time for new engineers</li>
<li>Dependence on a small number of key experts</li>
</ul>

<h4>Information-related</h4>
<ul>
<li>Time spent searching for information before equipment repair</li>
<li>Missing or incomplete repair history</li>
<li>Absence of a unified knowledge base</li>
<li>Knowledge scattered across paper journals, Excel files, email, shared folders, and individual memory</li>
<li>Difficulty finding similar past cases</li>
<li>Outdated or incomplete technical documentation</li>
</ul>

<h4>Organisational</h4>
<ul>
<li>Information transfer between shifts</li>
<li>Heavy manual documentation burden</li>
<li>Loss of information in handovers</li>
<li>Duplication of records</li>
</ul>

<h4>Operational</h4>
<ul>
<li>Long fault diagnosis times</li>
<li>Repetition of previously known errors</li>
<li>Insufficient time for preventive maintenance</li>
<li>Extended equipment downtime</li>
</ul>

<h4>Causal model</h4>
<pre>
Experienced specialists leave
            ↓
Loss of production knowledge
            ↓
Absence of a unified digital memory
            ↓
Long information search  ·  Repeated errors  ·  Slow onboarding
            ↓
Lost time and money
</pre>
<p>
        Virtually all of the most common problems are downstream effects of one root cause:
        the lack of an effective system for accumulating and using production knowledge.
</p>
</section>

<section>
<h3>Why This Matters Now</h3>
<p>
        Knowledge management problems have existed for decades.
        Several converging factors make them critical today.
</p>

<h4>Aging engineering workforce</h4>
<p>
        A significant share of the most experienced specialists is approaching retirement.
        Simultaneously, enterprises face a shortage of younger engineers.
        When 20–25 % of the workforce over 55 leaves, undocumented knowledge leaves with them.
</p>

<h4>Increasing equipment complexity</h4>
<p>
        Modern machines require deeper and more specialised knowledge for operation and maintenance.
</p>

<h4>Accumulation of digital data</h4>
<p>
        Enterprises already hold large volumes of electronic documentation, repair logs, photos, and other records.
        Most of this material remains fragmented and underused.
</p>

<h4>Maturity of language models</h4>
<p>
        For the first time, modern language models can work effectively with large volumes of internal enterprise documentation
        in natural language — <em>provided</em> that knowledge has first been captured and structured.
</p>
</section>

<section>
<h3>Proposed Direction: Digital Memory of the Enterprise</h3>
<p>
        The working hypothesis follows directly from the problem map:
</p>
<blockquote>
        The main constraint on AI adoption in industry is not the insufficient maturity of AI models,
        but the shortage of high-quality, structured, and accumulated production knowledge.
</blockquote>
<p>
        If confirmed by field research, the first stage of digital transformation should be
        the creation of a unified digital memory of the enterprise.
</p>
<p>
        Such a system should bring together:
</p>
<ul>
<li>technical documentation</li>
<li>repair history</li>
<li>photos and video</li>
<li>diagnostic results</li>
<li>work instructions</li>
<li>engineer recommendations</li>
<li>shift logs</li>
<li>accumulated practical operating experience</li>
</ul>
<p>
        Once this foundation exists, AI becomes a natural next step rather than an isolated project.
        Typical uses include:
</p>
<ul>
<li>intelligent (semantic) search</li>
<li>analysis of recurring failures</li>
<li>detection of operating patterns</li>
<li>recommendations for engineers</li>
<li>support for new employees (onboarding)</li>
<li>automated documentation</li>
<li>analysis of accumulated statistics</li>
<li>prediction of potential equipment failures</li>
</ul>
<p>
        In short, AI starts working on the enterprise’s own experience instead of generic internet knowledge.
</p>

<h4>Recommended sequence</h4>
<p>
        <strong>Stage 1 — Unified production knowledge base</strong><br>
        Object-oriented digital card for every equipment unit.
        Integration with existing ERP, MES, CMMS, and file stores
        (a layer on top of current systems, not a replacement).
</p>
<p>
        <strong>Stage 2 — Reliable data accumulation and documentation culture</strong><br>
        Simplified input (mobile, voice, photo), incentives for staff, data quality control, versioning.
</p>
<p>
        <strong>Stage 3 — Intelligent services</strong><br>
        Semantic search with source citations, recurring failure analysis, recommendations,
        automated documentation, prediction.
</p>

<h4>Organisational conditions for success</h4>
<p>
        Technology alone is insufficient. Critical conditions include:
</p>
<ul>
<li>dedicated time and incentives for documentation (otherwise data entry remains formal)</li>
<li>interfaces designed for shop-floor reality (mobile devices, gloves, noise)</li>
<li>data quality control</li>
<li>integration with the existing system landscape rather than creation of another silo</li>
<li>ability to operate in a closed contour (on-prem / private cloud), compliance with critical information infrastructure requirements,
            and use of domestic language models or the ability to fine-tune them</li>
</ul>
</section>

<section>
<h3>Practical Example: Manufacturing Knowledge Management System (MKMS)</h3>
<p>
        One possible implementation of the approach described above is the
        Manufacturing Knowledge Management System (MKMS).
</p>
<p>
        MKMS is positioned as the first infrastructural layer of digital transformation,
        not as a complete AI solution. Its primary purpose is to form the digital memory of the enterprise
        by giving every equipment unit its own digital card that consolidates documentation,
        repair history, media, and engineer comments.
</p>
<p>
        This creates the foundation on which intelligent search, analysis, and decision-support services can later be built.
</p>
<ul>
<li><a href="https://gelassen.github.io/2026/06/20/case-study-manufactory-knowledge-management-system.html">Case Study</a></li>
<li><a href="https://gelassen.github.io/manufactory-knowledge-management-system/">Project documentation</a></li>
<li><a href="https://github.com/Gelassen/manufactory-knowledge-management-system">Source code</a></li>
</ul>

<h4>What digital memory does <em>not</em> solve</h4>
<p>
        Creating a digital memory of the enterprise does not eliminate:
</p>
<ul>
<li>physical wear of equipment</li>
<li>lack of investment</li>
<li>design errors</li>
<li>capacity shortages</li>
<li>the need for genuine engineering expertise</li>
</ul>
<p>
        It does, however, substantially reduce the time and knowledge losses that occur
        at almost every stage of the equipment life cycle,
        and it creates the necessary conditions for effective subsequent use of AI.
</p>
</section>

<section>
<h3>Next Step: Field Verification</h3>
<p>
        The logical next stage is verification of the working hypothesis on a representative sample
        of industrial enterprises (for example, in Moscow) through structured interviews
        conducted directly on production sites.
</p>
<p>
        Objectives:
</p>
<ul>
<li>confirm or adjust the problem map and priorities</li>
<li>assess current maturity of production knowledge management</li>
<li>collect quantitative data (search time, share of documented repairs, onboarding cost)</li>
<li>formulate a grounded AI roadmap based on real needs rather than technology expectations</li>
</ul>
<p>
        A minimum sample of 8–12 enterprises from one or two priority industries,
        with interviews covering the full range of roles listed earlier, would provide a solid empirical base.
</p>
</section>

<section>
<h3>Conclusion</h3>
<p>
        Discussion of Artificial Intelligence in manufacturing should not begin with models, platforms, or computing infrastructure.
</p>
<p>
        The primary task is to create the conditions under which enterprise knowledge becomes accessible,
        accumulated, structured, and suitable for analysis.
</p>
<p>
        Production knowledge should be treated as a strategic asset of the enterprise —
        alongside equipment, technology, people, and intellectual property.
</p>
<p>
        Artificial Intelligence does not create this asset.
        It only makes it possible to use the knowledge the enterprise has already accumulated
        (or managed to preserve) far more effectively.
</p>
<p>
        The next step is field verification of this hypothesis.
        Only after such verification will it be possible to construct a justified AI roadmap
        grounded in the real needs of modern manufacturing rather than in technological expectations.
</p>
<p>
        Building the digital memory of the enterprise is therefore a necessary preparatory stage
        for any serious application of AI in industry.
</p>
</section>

<section>
<h3>Related Publications</h3>
<a href="https://gelassen.github.io/2026/06/20/case-study-manufactory-knowledge-management-system.html">
        Case study: manufactory knowledge management system (KMS)
</a> <br>
<a href="https://gelassen.github.io/2026/07/02/artificial-intelligence-applied-to-the-government.html">
        AI applied to the Government: Transforming Public Administration into a Self-Learning System
</a> <br>
<a href="https://gelassen.github.io/2026/06/19/artificial-intelligence-in-education-and-management.html">
        Artificial Intelligence in Education and Management: Strategic Framework, Risks, and Practical Implications
</a>
</section>
</article>
</body>
</html>]]></content><author><name>Gelassen</name></author><summary type="html"><![CDATA[Executive Summary Most discussions about Artificial Intelligence in manufacturing start with technology: large language models, computer vision, predictive analytics, or digital twins. The usual sequence is familiar — first choose a technology, then look for problems it might solve. This analysis takes the opposite approach. It starts with real production problems observed across Russian and international manufacturing enterprises. Only after identifying the most persistent and costly problems does it examine where digital tools and AI can actually help. The central finding is straightforward: The majority of recurring operational problems in manufacturing are not caused by the absence of modern AI models. They are caused by the absence of an effective system for capturing, storing, searching, and reusing production knowledge — what can be called the digital memory of the enterprise. The working hypothesis is therefore: The primary constraint on effective AI adoption in industry today is not the maturity of the models themselves, but the lack of high-quality, structured, and accumulated production knowledge. AI can significantly improve operational efficiency only when it has something real to work with. Recommended sequence: Build a unified digital knowledge base (the enterprise’s digital memory). Establish reliable data accumulation and documentation practices. Deploy intelligent services on top of that foundation (semantic search, recurring failure analysis, recommendations, automated documentation, prediction). This post is a preliminary analysis based on open sources. The hypothesis requires field verification through interviews on actual production sites. A whole document is available by link]]></summary></entry><entry><title type="html">Lightweight BI system for university, part I</title><link href="https://gelassen.github.io/2026/07/11/bi-system-for-university-part-I.html" rel="alternate" type="text/html" title="Lightweight BI system for university, part I" /><published>2026-07-11T00:00:00+00:00</published><updated>2026-07-11T00:00:00+00:00</updated><id>https://gelassen.github.io/2026/07/11/bi-system-for-university-part-I</id><content type="html" xml:base="https://gelassen.github.io/2026/07/11/bi-system-for-university-part-I.html"><![CDATA[<!DOCTYPE html>
<html lang="en">
<head>
    <meta charset="UTF-8">
    <meta name="viewport" content="width=device-width, initial-scale=1.0">
    <title>Lightweight BI system for university, part I</title>
    <link rel="stylesheet" href=".css/general.css">
</head>
<body>
    <article>
        <section>
            <h3>Executive summary</h3>

            <p>
                This project demonstrates the development of a lightweight Business Intelligence
                system for a university Learning Management System (LMS), designed to help
                instructors identify learning patterns, detect at-risk students, and reduce
                the time required to review student performance.
            </p>

            <p>
                The primary objective is to decrease manual analysis of a student group from
                approximately <strong>40 minutes to 5–10 minutes</strong> by providing
                explainable analytics instead of relying on black-box AI models. Because the
                customer prohibits the use of Large Language Models (LLMs) for educational
                decision-making, the solution follows <strong>Explainable AI (xAI)</strong>
                principles, where every recommendation is accompanied by evidence, alternative
                interpretations, confidence levels, and known limitations.
            </p>

            <p>
                The project was implemented under several practical constraints, including
                limited development time, restricted access to the production LMS, and strict
                personal data protection requirements. To overcome these limitations,
                a <strong>synthetic data generator</strong> was developed to reproduce the
                structure and statistical characteristics of the real LMS database while
                avoiding the use of sensitive student information.
            </p>

            <p>
                The resulting system consists of four major components:
            </p>

            <ul>
                <li>a synthetic LMS data generator for development and testing;</li>
                <li>an incremental analytics engine that processes only changed data instead of recomputing the entire dataset;</li>
                <li>an explainable rule-based analytics pipeline that transforms raw LMS events into actionable educational insights;</li>
                <li>an interactive Streamlit dashboard for visual exploration of student performance, engagement, risks, and recommendations.</li>
            </ul>

            <p>
                Unlike traditional BI dashboards that primarily display aggregated metrics,
                the system focuses on <strong>decision support</strong>. It combines
                quantitative indicators with structured explanations, helping instructors
                understand not only <em>what</em> happened, but also <em>why</em>, how
                confident the system is, and which interventions should be considered.
            </p>

            <p>
                The current prototype processes synthetic datasets representing a 
                single faculty for period of one year and was designed with asynchronous 
                architecture and incremental data processing for future scaling.
            </p>

            <p>
                Although the current implementation covers only part of the requested
                functionality, it establishes a modular architecture that can be extended
                with additional analytical models, visualization capabilities, and
                educational recommendations without fundamental redesign. The fundamental 
                objective is to support user in his\her decision making.
            </p>
            <p>
                <img src="/assets/images/2026-07-11/architecture-diagram.png"></img>
            </p>
        </section>
        <section>
            <h3>About the customer</h3>
            <p>
                My current customer is a group of university professors and lectors 
                whose initiative is to apply the power of AI to simplify their work. 
            </p>
            <p>
                The idea is to help them to analyze the data from their LMS - reduce 
                time on group's work review from 40 minutes to 5 - 10 minutes.
            </p>
            <p>
                Currently, the customer uses LMS system to manage the students' work 
                and grades. The LMS provides dashboards with basic analytical data. 
                Review of such work takes time and could potentially reduced by 
                applying AI and BI tools.
            </p>
            <p>
                LLM usage is prohibited there, the results should be explainable, 
                therefore principles of xAI should be used here.   
            </p>
            <p>
                System should be able to:
                <ul>
                    <li>visualize of the distribution of responses by chapters, topics and questions</li>
                    <li>identifies topics with low (<50%) and high (>80%) performance</li>
                    <li>classifies error types</li>
                    <li>generates natural language output with specific recommendations</li>
                    <li>show total scores and trends</li>
                    <li>show completion time, attempts, deadlines</li>
                    <li>show task difficulty thresholds</li>
                    <li>show attendance and activity</li>
                    <li>comparison of different metrics (performance ↔ time ↔ attempts)</li>
                    <li>identification of tasks that no one has solved/that everyone has solved</li>
                    <li>generating recommendations (simplify/complicate)</li>
                    <li>automatic report on at-risk students</li> 
                    <li>personalized recommendations on topics and tasks</li>
                    <li>a summary report on the risk group with rationale</li>
                    <li>recommendations for interventions (what to repeat, who to focus on)</li>
                </ul>
            </p>
        </section>
        <section>
            <h3>Discovery</h3>
            <p>
                Despite on new business domain and technology discovery phase 
                has been concisely skipped or better to say scattered among 
                the whole project. 
            </p>
            <p>
                Limited budget and tight schedule push me and customer to 
                agreed on R&D form ow work when results are not strictly aligned 
                to time constraints in the favor of maximum project's velocity. 
            </p>
        </section>
        <section>
            <h3>Ethical constraints and system limitations</h3>

            <p>
                As the engineer designing this system, I have to assume that users will
                rely on its outputs when making real-world decisions. In practice, this
                means they delegate part of their cognitive work to the system. If the
                analytical process is flawed or the conclusions are misleading, the
                resulting harm extends far beyond a single incorrect prediction.
            </p>

            <p>
                There is currently no algorithm capable of modelling the full complexity
                of the real world. Every analytical model is necessarily incomplete and
                operates under assumptions and uncertainty. Consequently, fully
                autonomous machine analytics cannot be considered universally correct by
                design. An important responsibility of the system is therefore to make
                its own limitations visible rather than creating an illusion of
                certainty.
            </p>

            <p>
                Based on these principles, the reporting model was designed together
                with a Large Language Model (LLM) to support human reasoning rather than
                replace it. The objective is not to generate authoritative answers but
                to provide transparent, evidence-based analytical assistance. This
                design philosophy is consistent with the direction taken by several
                state-of-the-art analytical platforms while introducing explicit
                mechanisms for uncertainty and alternative explanations.
            </p>

            <table>
                <thead>
                    <tr>
                        <th>Design principle</th>
                        <th>Typical LLM assistants<br>(ChatGPT, Copilot, Gemini, Claude)</th>
                        <th>Enterprise decision-support systems<br>(e.g. Palantir AIP)</th>
                        <th>Proposed architecture</th>
                    </tr>
                </thead>
                <tbody>
                    <tr>
                        <td>Separate observations from conclusions</td>
                        <td>Partially</td>
                        <td>Yes</td>
                        <td><strong>Explicitly enforced</strong></td>
                    </tr>
                    <tr>
                        <td>Evidence supporting every conclusion</td>
                        <td>Available when sources exist</td>
                        <td>Yes</td>
                        <td><strong>Mandatory (Finding → Evidence)</strong></td>
                    </tr>
                    <tr>
                        <td>Explain reasoning</td>
                        <td>Partial</td>
                        <td>Strong</td>
                        <td><strong>Integrated into every insight</strong></td>
                    </tr>
                    <tr>
                        <td>Represent uncertainty explicitly</td>
                        <td>Limited</td>
                        <td>Partial</td>
                        <td><strong>Dedicated uncertainty model</strong></td>
                    </tr>
                    <tr>
                        <td>Consider alternative explanations</td>
                        <td>Occasional</td>
                        <td>Supported</td>
                        <td><strong>Mandatory section of every report</strong></td>
                    </tr>
                    <tr>
                        <td>Separate recommendations from observations</td>
                        <td>Usually mixed</td>
                        <td>Generally separated</td>
                        <td><strong>Architecturally separated</strong></td>
                    </tr>
                    <tr>
                        <td>Auditability and traceability</td>
                        <td>Limited</td>
                        <td>High</td>
                        <td><strong>Designed as a core capability</strong></td>
                    </tr>
                    <tr>
                        <td>Human remains the final decision maker</td>
                        <td>Yes</td>
                        <td>Yes</td>
                        <td><strong>Explicit design principle</strong></td>
                    </tr>
                </tbody>
            </table>

            <p>
                The proposed architecture intentionally follows an <em>evidence-first</em>
                approach instead of a traditional <em>LLM-first</em> workflow. Rather
                than allowing the language model to generate conclusions directly from
                raw data, the system first derives measurable indicators, produces
                findings supported by evidence, estimates confidence, records
                alternative explanations, and only then formulates recommendations.
                This preserves transparency, improves auditability, and ensures that
                responsibility for the final decision always remains with the human
                expert.
            </p>

        </section>

        <section>
            <h3>Solution</h3>
            <!-- architecture diagram -->
            <p>
                <img src="/assets/images/2026-07-11/big-picture.png"></img>
            </p>
            <h4>Existing LMS data model</h4>
            <p>
                Before to start the development of the BI system, I have to 
                understand the existing LMS data model. 
            </p>
            <p>
                Time budget for this project is quite limited and I have been 
                using LLM to speed up my work here. It is quite risky, because 
                instead of working directly with LMS I use a mediator which 
                almost always lead to distortion of information. Moreover LLMs 
                are known for making mistakes, therefore such mistakes *might* 
                go into the system.
            </p>
            <p>
                Limited time and restrict direct access to organization's LMS 
                system makes LLMs usage here as a reasonable choice.  
            </p>
            <p>
                <img src="/assets/images/2026-07-11/data-model.svg"></img>
            </p>
            <h4>Actual data under GDRP like policy</h4>
            <p>
                Russia has its own analog of GDRP like policy to secure personal data 
                of its citizens. Right on the private life and privacy of the 
                personal information is a fundamental constitutional right. 
                Violation of this is strictly prohibited.  
            </p>
            <p>
                The form of my current contract allows to send me this data, but 
                personal circumstances will result to the actual data breach without 
                any malicious intentions from my side. In such situation, I 
                usually inform my customer about this risks by email before to go 
                forward.  
            </p>
            <p>
                This issue and general bureaucracy of the current organization 
                makes me use a workaround with synthetic data model to simulate 
                the actual data.
            </p>
            <h4>Synthetic data model as a workaround</h4>

            <p>To address data protection constraints and enable rapid development, I implemented a synthetic data generator that mimics the structure and statistical properties of real LMS data.</p>

            <p><strong>Generator architecture:</strong></p>
            <ul>
                <li>Built with Python using Pandas, NumPy, and Pydantic for data validation</li>
                <li>Configurable random seed (42) ensures reproducible results</li>
                <li>Generates <strong>9 interconnected tables</strong> matching the LMS data model</li>
            </ul>

            <p><strong>Student profiles:</strong></p>
            <p>Five student categories with distinct academic characteristics:</p>
            <ul>
                <li><strong>Excellent</strong> (15%): mean 97, σ=2.0 — minimal attempts, near-perfect scores</li>
                <li><strong>Strong</strong> (25%): mean 86, σ=5.0 — rare 2nd attempts</li>
                <li><strong>Average</strong> (35%): mean 68, σ=9.5 — 1-3 attempts</li>
                <li><strong>Weak</strong> (15%): mean 48, σ=11.5 — up to 4 attempts</li>
                <li><strong>Risk</strong> (10%): mean 28, σ=13.5 — low engagement, high variance</li>
            </ul>

            <p><strong>Data generation logic:</strong></p>
            <ul>
                <li><strong>12 topics</strong> in Economics with difficulty coefficients (0.10-0.87) and target means (37-94)</li>
                <li><strong>24 assignments</strong> (2 per topic) with realistic due dates</li>
                <li><strong>100 students</strong> with ID format ST0001-ST0100</li>
                <li><strong>Attempts</strong>: scores depend on profile, topic difficulty, and attempt number</li>
                <li><strong>10 questions per attempt</strong> with error type classification (logical, terminology, arithmetic)</li>
                <li><strong>Attendance rates</strong>: 38-97% based on student profile</li>
                <li><strong>Weekly activity metrics</strong>: forum posts, resource views, quiz launches</li>
            </ul>

            <p><strong>Anomaly injection:</strong></p>
            <p>To test outlier detection algorithms, the generator applies deliberate anomalies:</p>
            <ul>
                <li>Easy assignments → inflated scores (98/100)</li>
                <li>Hard assignments → deflated scores (5/100)</li>
                <li>Specific students: weak student scoring high on easy tasks, top student scoring low on hard tasks</li>
                <li>Question-level patterns: all correct for easy assignments, all incorrect for hard assignments</li>
            </ul>

            <p><strong>Output format:</strong></p>
            <p>9 CSV files fully compatible with the target BI dashboard, enabling immediate testing of all analytical features without exposing real student data.</p>
            <h4>Visualization layer</h4>

            <p>
                <img src="/assets/images/2026-07-11/data-visualisation.png"></img>
            </p>

            <p>
                The BI system uses <strong>Streamlit</strong> as the visualization framework, 
                providing an interactive dashboard for exploring student performance data. 
                The visualization layer is organized into several functional tabs, each 
                serving a specific analytical purpose.
            </p>
            <p>
                Streamlit is chosen for its rapid development capabilities. Until 
                this moment it has been sufficient, but further complexity of BI 
                insights will initiate migration for more rich solutions like 
                Tableau or others.  
            </p>

            <p><strong>Technology stack:</strong></p>
            <ul>
                <li><strong>Streamlit</strong> — rapid UI development without frontend complexity</li>
                <li><strong>Plotly</strong> — interactive charts with zoom, hover, and selection capabilities</li>
                <li><strong>Pandas</strong> — data manipulation and aggregation</li>
                <li><strong>Async SQLAlchemy</strong> — asynchronous database access for performance</li>
            </ul>

            <p><strong>Dashboard structure:</strong></p>

            <h5>1. Sidebar (Global Filters)</h5>
            <ul>
                <li><strong>Group filter</strong> — select one or multiple student groups</li>
                <li><strong>Student filter</strong> — individual student analysis or "All students" mode</li>
                <li><strong>Assignment type filter</strong> — filter by homework, quiz, or exam types</li>
                <li><strong>Date range picker</strong> — time period selection with min/max boundaries</li>
                <li><strong>Quick metrics</strong> — total questions, correct answers, average success rate</li>
            </ul>

            <h5>2. Themes Tab</h5>
            <ul>
                <li><strong>Theme performance chart</strong> — bar chart showing average scores by topic with color gradient (red-yellow-green)</li>
                <li><strong>Error distribution chart</strong> — error rates per topic with red gradient for problem areas</li>
                <li><strong>Detailed table</strong> — sortable data frame with avg_score, total_questions, correct_count, correct_rate, and error_rate</li>
            </ul>

            <h5>3. Student Profile Tab</h5>
            <ul>
                <li><strong>Profile badge</strong> — displays student's academic category (excellent/strong/average/weak/risk)</li>
                <li><strong>Performance heatmap</strong> — topic-by-topic success visualization with color coding</li>
                <li><strong>Interactive bar chart</strong> — student's best performance per topic with color mapping</li>
            </ul>

            <h5>4. Questions Tab</h5>
            <ul>
                <li><strong>Topic selector</strong> — dropdown to choose specific topic for drill-down</li>
                <li><strong>Question accuracy chart</strong> — percentage of correct answers per question (Q01-Q10)</li>
                <li><strong>Smart filtering</strong> — prompts to select individual student when dataset exceeds 500 rows for performance</li>
            </ul>

            <h5>5. Insights Tab</h5>
            <ul>
                <li><strong>Intelligent report generation</strong> — structured findings organized by topic</li>
                <li><strong>Metrics table</strong> — accuracy, difficulty, total questions, completion rate, error breakdown by type (logical, arithmetic, terminology)</li>
                <li><strong>Finding cards</strong> — each finding includes:</li>
                <ul>
                    <li><strong>Hypothesis</strong> — explanatory statement about observed pattern</li>
                    <li><strong>Observation</strong> — formatted evidence with pattern detection (low/high accuracy)</li>
                    <li><strong>Evidence list</strong> — supporting metrics with automatic percentage formatting</li>
                    <li><strong>Alternatives</strong> — alternative explanations for the finding</li>
                    <li><strong>Recommendations</strong> — actionable suggestions for instructors</li>
                    <li><strong>Limitations</strong> — interpretation boundaries and confidence constraints</li>
                </ul>
            </ul>

            <p><strong>Data flow:</strong></p>
            <ol>
                <li><strong>Repository layer</strong> — async queries to PostgreSQL via SQLAlchemy</li>
                <li><strong>Dataset builder</strong> — merges 5+ tables (students, topics, assignments, attempts, question_results) into a single denormalized DataFrame</li>
                <li><strong>Filter service</strong> — applies sidebar filters to the dataset</li>
                <li><strong>Analytics service</strong> — computes aggregations (theme_stats, question_stats, student_heatmap)</li>
                <li><strong>Chart service</strong> — generates Plotly figures with consistent styling</li>
                <li><strong>UI Presenter</strong> — formats evidence text, translates metrics to Russian, handles null values gracefully</li>
            </ol>

            <p><strong>Key design decisions:</strong></p>
            <ul>
                <li><strong>Separation of concerns</strong> — services handle business logic, presenters manage UI formatting</li>
                <li><strong>Async architecture</strong> — non-blocking database calls for responsive UI</li>
                <li><strong>Type safety</strong> — dataclasses and DTOs enforce contract between layers</li>
                <li><strong>Graceful degradation</strong> — user-friendly messages when data is missing or filters yield empty results</li>
                <li><strong>Russian localization</strong> — all UI labels, metrics, and findings are localized for the target audience</li>
            </ul>

            <p><strong>Performance optimizations:</strong></p>
            <ul>
                <li><strong>@st.cache_data</strong> — caches the base dataset to avoid repeated database queries</li>
                <li><strong>Smart filtering</strong> — prompts student selection when data volume exceeds 500 rows</li>
                <li><strong>Aggregated computations</strong> — pre-computed metrics in analytics database for fast retrieval</li>
            </ul>
            <h4>BI analytics</h4>
            <p>The analytics engine is an <strong>asynchronous Python application</strong> that processes LMS data through a pipeline architecture, transforming raw question results into actionable insights with explainable AI principles.</p>

            <p><strong>Core components:</strong></p>

            <h5>1. Data Ingestion Layer</h5>
            <ul>
                <li><strong>Database Repository</strong> — async SQLAlchemy queries for topics, assignments, question results, and activity data</li>
                <li><strong>Changes Repository</strong> — tracks unprocessed entity changes (topics, assignments, question results, students, activity) for incremental processing</li>
                <li><strong>Pipeline Lock Repository</strong> — ensures only one pipeline instance runs at a time using PostgreSQL advisory locks</li>
            </ul>

            <h5>2. State Builder</h5>
            <ul>
                <li><strong>Hydration Repository</strong> — resolves topic IDs from changed entities (e.g., maps question_results → assignments → topics)</li>
                <li><strong>Analytics State Builder</strong> — assembles a complete <code>AnalyticsState</code> object containing all data needed for a batch (topics, assignments, question results, activity)</li>
            </ul>

            <h5>3. Processing Pipeline</h5>
            <ul>
                <li><strong>Metrics Engine</strong> — computes 11 metrics per topic: accuracy, error distribution (logical/arithmetic/terminology), average score, completion rate, difficulty, pressure, and engagement</li>
                <li><strong>Rule Engine</strong> — evaluates 7 rules (LowAccuracy, LogicalError, ArithmeticError, TerminologyError, HighPressure, EngagementMismatch, StableHighPerformance) against each topic's metrics</li>
                <li><strong>Explanation Engine</strong> — generates human-readable reports with hypotheses, severity levels, confidence scores, alternative explanations, and recommended actions</li>
            </ul>

            <h5>4. Persistence Layer</h5>
            <ul>
                <li>Saves all results atomically in a single transaction: metrics → findings → evidence → explanations → alternative explanations → recommended actions → uncertainty notes → limitations → missing context</li>
                <li>Creates an <code>AnalyticsRun</code> record to track each execution</li>
                <li>Marks processed changes as acknowledged</li>
            </ul>

            <p><strong>Execution flow:</strong></p>
            <ol>
                <li>Scheduler runs periodically (default: 300 seconds)</li>
                <li><strong>Acquire lock</strong> — prevent concurrent runs</li>
                <li><strong>Load changes</strong> — fetch unprocessed entity changes</li>
                <li><strong>Build impact</strong> — resolve affected topic IDs from changes</li>
                <li><strong>Hydrate state</strong> — load all data for impacted topics</li>
                <li><strong>Compute metrics</strong> — aggregate question results by topic</li>
                <li><strong>Apply rules</strong> — detect patterns and anomalies</li>
                <li><strong>Generate explanations</strong> — create human-readable reports</li>
                <li><strong>Persist results</strong> — save to database atomically</li>
                <li><strong>Acknowledge changes</strong> — mark as processed</li>
                <li><strong>Release lock</strong> — allow next run</li>
            </ol>

            <p><strong>Key design decisions:</strong></p>
            <ul>
                <li><strong>Incremental processing</strong> — processes only changed data using the <code>changed_entities</code> table, avoiding full recomputation</li>
                <li><strong>Batch isolation</strong> — each batch runs in its own transaction with rollback on failure</li>
                <li><strong>Separation of concerns</strong> — metrics, rules, and explanations are independent modules</li>
                <li><strong>Explainable AI (xAI)</strong> — outputs are human-readable with hypotheses, evidence, alternatives, and uncertainty notes — no black-box LLMs</li>
                <li><strong>Confidence scoring</strong> — each finding includes a confidence level (high/medium/low) based on rule score</li>
                <li><strong>Uncertainty tracking</strong> — limitations and missing context are stored alongside each finding</li>
            </ul>

            <p><strong>Data model:</strong></p>
            <ul>
                <li><strong>Topics</strong> — core domain entity with difficulty and target_mean</li>
                <li><strong>Assignments</strong> — linked to topics, each with type, max_score, due_date</li>
                <li><strong>Question Results</strong> — per-question scores with error_type classification</li>
                <li><strong>Activity Weekly</strong> — forum posts, resource views, quiz launches for engagement calculation</li>
            </ul>

            <p><strong>Output artifacts:</strong></p>
            <ul>
                <li><strong>topic_metrics</strong> — 11 numerical indicators per topic</li>
                <li><strong>findings</strong> — detected patterns with severity and confidence</li>
                <li><strong>finding_evidence</strong> — raw metrics supporting each finding</li>
                <li><strong>explanations</strong> — human-readable hypotheses with confidence</li>
                <li><strong>alternative_explanations</strong> — other possible interpretations</li>
                <li><strong>recommended_actions</strong> — actionable suggestions for instructors</li>
                <li><strong>uncertainty_notes</strong> — limitations and missing context</li>
            </ul>
            <h4>Docker orchestration</h4>
            <p>
                Each part of the BI system is packed into docker container and 
                orchestrated by docker-compose. This allows to run the system 
                on any machine with docker installed without any additional 
                configuration.
            </p>
            <h4>Incremental analytics</h4>

            <p>The system implements an <strong>incremental batch processing</strong> approach to avoid full recomputation of analytics on every data change. Instead of recalculating all topics, it detects which entities have changed, resolves the affected topics, and recomputes only those topics.</p>

            <p><strong>How it works:</strong></p>
            <ol>
                <li><strong>Change tracking</strong> — database triggers register every INSERT/UPDATE/DELETE on source tables (topics, assignments, question_results, activity_weekly) into the <code>changed_entities</code> table</li>
                <li><strong>Impact resolution</strong> — the pipeline resolves which topic IDs are affected by each changed entity (e.g., question_result → assignment → topic)</li>
                <li><strong>State hydration</strong> — loads only the data needed for impacted topics</li>
                <li><strong>Computation</strong> — runs metrics, rules, and explanation engines on the hydrated subset</li>
                <li><strong>Acknowledgment</strong> — marks changed entities as processed after successful persistence</li>
            </ol>

            <p><strong>Comparison with industry approaches:</strong></p>

            <table border="1" cellpadding="6" style="border-collapse: collapse; width: 100%; font-size: 0.9em;">
                <thead style="background: #f0f0f0;">
                    <tr>
                        <th style="text-align: left;">Approach</th>
                        <th style="text-align: left;">Granularity</th>
                        <th style="text-align: left;">Latency</th>
                        <th style="text-align: left;">Complexity</th>
                        <th style="text-align: left;">Use case</th>
                    </tr>
                </thead>
                <tbody>
                    <tr>
                        <td><strong>Full recomputation</strong><br><small>(traditional BI)</small></td>
                        <td>Entire dataset</td>
                        <td>Minutes–hours</td>
                        <td>Low</td>
                        <td>Daily batch reports</td>
                    </tr>
                    <tr>
                        <td><strong>Stream processing</strong><br><small>(Apache Flink, Kafka Streams)</small></td>
                        <td>Event-level</td>
                        <td>Milliseconds–seconds</td>
                        <td>Very high</td>
                        <td>Real-time dashboards, fraud detection</td>
                    </tr>
                    <tr>
                        <td><strong>Lambda architecture</strong><br><small>(batch + stream layers)</small></td>
                        <td>Hybrid</td>
                        <td>Mixed</td>
                        <td>High</td>
                        <td>Large-scale data platforms</td>
                    </tr>
                    <tr>
                        <td><strong>Materialized views</strong><br><small>(PostgreSQL, ClickHouse)</small></td>
                        <td>Pre-aggregated</td>
                        <td>Sub-second</td>
                        <td>Medium</td>
                        <td>Read-optimized analytics</td>
                    </tr>
                    <tr style="background: #e6f3ff;">
                        <td><strong>Incremental batch (our system)</strong></td>
                        <td>Topic-level (impact set)</td>
                        <td>1–5 minutes</td>
                        <td>Medium</td>
                        <td>Educational analytics with explainable AI</td>
                    </tr>
                </tbody>
            </table>

            <p><strong>Where our approach sits:</strong></p>
            <ul>
                <li><strong>vs. Full recomputation</strong> — significantly faster (topics scale ~10x better), avoids redundant processing of unchanged data</li>
                <li><strong>vs. Stream processing</strong> — simpler to implement and debug, no complex state management; trade-off is higher latency (minutes vs. milliseconds)</li>
                <li><strong>vs. Materialized views</strong> — more flexible because we can run arbitrary Python logic (rules, explanations, uncertainty notes), not just SQL aggregations</li>
                <li><strong>vs. Lambda</strong> — intentionally minimal; one batch pipeline is sufficient for the domain</li>
            </ul>

            <p><strong>Key differentiators:</strong></p>
            <ul>
                <li><strong>Explainability built-in</strong> — every incrementally computed finding includes hypothesis, evidence, alternatives, and confidence</li>
                <li><strong>Transactional integrity</strong> — each batch runs in a database transaction; rollback on failure prevents partial results</li>
                <li><strong>Deadlock safety</strong> — pipeline locks ensure only one run executes at a time</li>
                <li><strong>Idempotent processing</strong> — each change is processed exactly once (<code>processed</code> flag)</li>
                <li><strong>Auditable</strong> — every run is stored in <code>analytics_runs</code> with source snapshot and status</li>
            </ul>

            <p><strong>Limitations and future improvements:</strong></p>
            <ul>
                <li><strong>No real-time updates</strong> — 5-minute batch interval is acceptable for education analytics but not for live dashboards</li>
                <li><strong>Simple impact resolution</strong> — topic-level granularity; fine-grained (student-level or question-level) recomputation would reduce work further</li>
                <li><strong>No windowing</strong> — changes accumulate; a sliding time window would allow purging old changes from the queue</li>
                <li><strong>Observability</strong> — currently lacks monitoring of queue size, processing time, and failure rates</li>
            </ul>

            <p>The incremental batch approach is a pragmatic choice that balances complexity, performance, and maintainability. It fits the educational analytics domain perfectly — where near-real-time insights with explainable AI are more valuable than sub-second latency.</p>
        </section>
        <section>
            <h3>Next steps</h3>
            <p>
                Only part of the requirements has been implemented. Next steps 
                would require further extension to meet with all current 
                requirements from stakeholders. 
            </p>
        </section>
        <section>
            <h3>Related publications</h3>
            <p>
                <a href="https://gelassen.github.io/2026/08/29/lightweight-BI-for-university-part-II.html">Lightweight BI system for university, part II: how the analytics is built</a><br>
                <a href="https://gelassen.github.io/2026/09/12/lightweight-BI-system-for-university-part-III.html">Lightweight BI system for university, part III: UX redesign targeting 5–10 minute weekly review</a> <br>
                <a href="https://gelassen.github.io/2024/11/02/case-study-developing-forecast-sales-system-for-a-major-airline.html">Case study: developing forecast sales system for a major airline</a> <br>
            </p>
        </section>
    </article>
</body>]]></content><author><name>Gelassen</name></author><category term="BI," /><category term="custom" /><category term="software" /><category term="development," /><category term="decision" /><category term="making" /><category term="support" /><summary type="html"><![CDATA[Lightweight BI system for university, part I Executive summary]]></summary></entry><entry><title type="html">AI applied to the Government: Transforming Public Administration into a Self-Learning System</title><link href="https://gelassen.github.io/2026/07/02/artificial-intelligence-applied-to-the-government.html" rel="alternate" type="text/html" title="AI applied to the Government: Transforming Public Administration into a Self-Learning System" /><published>2026-07-02T00:00:00+00:00</published><updated>2026-07-02T00:00:00+00:00</updated><id>https://gelassen.github.io/2026/07/02/artificial-intelligence-applied-to-the-government</id><content type="html" xml:base="https://gelassen.github.io/2026/07/02/artificial-intelligence-applied-to-the-government.html"><![CDATA[<!DOCTYPE html>

<html lang="en">
<head>
    <meta charset="UTF-8">
    <meta name="viewport" content="width=device-width, initial-scale=1.0">
    <link rel="stylesheet" href=".css/general.css">
</head>
<body>
<article>

<section>
    <h3>Executive Summary</h3>

    <p>
        Rising interests of the government to apply AI to the public administration 
        is a case behind creating this publication based on my previous works. To 
        keep it short and simple I emphasize 3-4 key ideas that should give maximum 
        outcome. AI could strengthen governance as well as make it worse, it is 
        important to understand and mitigate such risks which had been covered in 
        my others publications pointed out in the references
    <p>
        Most discussions about Artificial Intelligence in the public sector focus on
        automating paperwork, accelerating administrative procedures, or replacing
        routine tasks performed by civil servants.
    </p>

    <p>
        While these applications are valuable, they overlook a much larger opportunity.
        AI makes it possible to rethink government itself—not merely as an organization
        that processes information, but as a system capable of continuously learning
        from its own decisions.
    </p>

    <p>
        Instead of treating Artificial Intelligence as another digital service,
        it can become the foundation of a self-learning model of public administration,
        where knowledge is accumulated rather than forgotten, analyzed rather than archived,
        and reused rather than rediscovered.
    </p>

    <blockquote>
        "The twentieth century gave governments computation.
        The twenty-first century should give governments the ability to learn."
    </blockquote>

</section>

<section>
    <h3>Why This Matters</h3>

    <p>
        Public administration is becoming exponentially more complex.
    </p>

    <p>
        Governments must simultaneously process increasing volumes of information,
        rapidly evolving legislation, interconnected policy challenges,
        technological change, and growing societal expectations.
    </p>

    <p>
        Yet the prevailing model of governance remains largely reactive.
        Similar problems are repeatedly analyzed from scratch,
        while valuable institutional knowledge remains scattered across
        documents, departments, and individual experts.
    </p>

    <p>
        When projects conclude or experienced personnel leave,
        much of this knowledge disappears with them.
    </p>

    <p>
        As a consequence, governments often repeat previous analyses,
        revisit familiar debates, and occasionally reproduce the same mistakes.
    </p>

</section>

<section>
    <h3>The Central Idea</h3>

    <p>
        The primary role of Artificial Intelligence should not be the automatic
        generation of documents or the replacement of public officials.
    </p>

    <p>
        Its strategic purpose should be to transform government into a
        self-learning system.
    </p>

    <p>
        Every policy decision should become a source of new knowledge.
    </p>

    <p>
        Every completed project should improve future decision-making.
    </p>

    <p>
        Every managerial failure should become institutional experience rather
        than institutional memory loss.
    </p>

    <p>
        In other words, governments should learn in the same way successful
        organizations continuously improve through accumulated experience.
    </p>

</section>

<section>
    <h3>Key Components of a Learning Government</h3>

    <h4>1. Personalized Continuous Learning</h4>

    <p>
        AI can continuously analyze each civil servant's responsibilities,
        legislative updates, completed work, and emerging professional challenges.
    </p>

    <p>
        Based on this information, the system generates a personalized
        daily learning program lasting approximately 20 to 60 minutes.
    </p>

    <p>
        Learning becomes an integrated part of everyday work rather than
        an occasional training event.
    </p>

    <h4>2. Scenario Modeling</h4>

    <p>
        Before important policy decisions are considered,
        AI automatically constructs several alternative development scenarios.
    </p>

    <p>
        Each scenario evaluates:
    </p>

    <ul>
        <li>possible consequences;</li>
        <li>associated risks;</li>
        <li>required resources;</li>
        <li>estimated probability;</li>
        <li>cross-sector impacts.</li>
    </ul>

    <p>
        This shifts decision-making from reactive governance toward proactive
        strategic management.
    </p>

    <h4>3. Intelligent Decision Support</h4>

    <p>
        Before reviewing a policy issue, decision-makers receive an analytical
        briefing generated automatically by the system.
    </p>

    <p>
        The briefing includes:
    </p>

    <ul>
        <li>historical precedents;</li>
        <li>reasons behind previous decisions;</li>
        <li>observed outcomes;</li>
        <li>alternative approaches;</li>
        <li>stakeholder analysis;</li>
        <li>identified risks;</li>
        <li>international experience;</li>
        <li>projected future consequences.</li>
    </ul>

    <p>
        AI does not replace human judgment.
        Instead, it provides decision-makers with the broadest possible
        informational foundation.
    </p>

    <h4>4. Institutional Memory</h4>

    <p>
        Perhaps the most important function of such a system is preserving
        organizational knowledge.
    </p>

    <p>
        Years after a decision has been made, government should still be able
        to reconstruct:
    </p>

    <ul>
        <li>why a particular decision was adopted;</li>
        <li>which alternatives were considered;</li>
        <li>what constraints existed;</li>
        <li>what forecasts were made;</li>
        <li>what outcomes were ultimately achieved.</li>
    </ul>

    <p>
        Institutional memory should no longer depend upon individual careers,
        organizational restructuring, or the survival of isolated documents.
    </p>

</section>

<section>
    <h3>Beyond Large Language Models</h3>

    <p>
        Building a learning government requires considerably more than deploying
        a single language model.
    </p>

    <p>
        The objective should be the creation of a comprehensive AI infrastructure,
        of which language models represent only one component.
    </p>

    <p>
        Such an infrastructure would include:
    </p>

    <ul>
        <li>AI foundation models;</li>
        <li>secure computing infrastructure;</li>
        <li>knowledge platforms;</li>
        <li>semantic search technologies;</li>
        <li>vector databases;</li>
        <li>agent-based systems;</li>
        <li>standardized integration with existing governmental information systems.</li>
    </ul>

    <p>
        A modular architecture also allows individual components to evolve
        independently without redesigning the entire system.
    </p>

</section>

<section>
    <h3>Expected Benefits</h3>

    <p>
        A learning model of public administration could:
    </p>

    <ul>
        <li>reduce the time required to prepare policy decisions;</li>
        <li>improve decision quality;</li>
        <li>support continuous professional development of civil servants;</li>
        <li>reduce dependence on individual personnel;</li>
        <li>preserve institutional knowledge across generations;</li>
        <li>increase the reuse of accumulated managerial experience;</li>
        <li>establish the technological foundation for future AI-enabled governance.</li>
    </ul>

</section>

<section>
    <h3>The Broader Perspective</h3>

    <p>
        The fundamental question is not how governments should introduce
        Artificial Intelligence into existing administrative procedures.
    </p>

    <p>
        The more important question is whether AI can help governments become
        organizations that continuously learn from their own experience.
    </p>

    <p>
        Throughout history, governments have accumulated power,
        territory, institutions, and information.
        In the coming decades, their comparative advantage may increasingly depend
        on something different:
        the ability to systematically accumulate knowledge,
        transform it into better decisions,
        and continuously improve through experience.
    </p>

    <p>
        If computation defined the digital state of the twentieth century,
        learning may define the intelligent state of the twenty-first.
    </p>

</section>
<section>
    <h3>Related Publications</h3>

    <a href="https://chatgpt.com/s/t_6a41293ca9948191a76e3f6d0d84c13a">Draft of the publication (russian)</a> <br>
    <a href="https://gelassen.github.io/2026/06/19/artificial-intelligence-in-education-and-management.html">
        Artificial Intelligence in Education and Management: Strategic Framework, Risks, and Practical Implications (June, 2026)
    </a> <br>
    <a href="https://gelassen.github.io/2025/12/20/cognitive-risks-of-using-ai-and-how-to-mitigate-them.html">
        Cognitive Risks of Using AI and How to Mitigate Them (December, 2025)
    </a> <br>
    <a href="https://gelassen.github.io/2024/06/23/the-modern-education-and-place-of-ai-here.html">
        The Modern Education and the Place of AI Here (June, 2024)
    </a>

</section>

</article>
</body>
</html>]]></content><author><name>Gelassen</name></author><summary type="html"><![CDATA[]]></summary></entry><entry><title type="html">Case study: manufactory knowledge management system (KMS)</title><link href="https://gelassen.github.io/2026/06/20/case-study-manufactory-knowledge-management-system.html" rel="alternate" type="text/html" title="Case study: manufactory knowledge management system (KMS)" /><published>2026-06-20T00:00:00+00:00</published><updated>2026-06-20T00:00:00+00:00</updated><id>https://gelassen.github.io/2026/06/20/case-study-manufactory-knowledge-management-system</id><content type="html" xml:base="https://gelassen.github.io/2026/06/20/case-study-manufactory-knowledge-management-system.html"><![CDATA[<!DOCTYPE html>
<html lang="en">
<head>
    <meta charset="UTF-8">
    <meta name="viewport" content="width=device-width, initial-scale=1.0">
    <link rel="stylesheet" href=".css/general.css">
</head>
<body>
<article>
    <section>
        <h3>Executive summary</h3>
        <p>
            This week I finished work on a minimum viable product (MVP) for a 
            manufacturing company that aims to reduce machine downtime and 
            therefore cut losses.
        </p>
        <p>
            It addresses the following pain point: "We have a machine. Where is 
            all the information about it, and how can we ensure that this 
            knowledge doesn't disappear when employees leave?". According to 
            available statistics, the depreciation rate of fixed assets in the 
            manufacturing industry is about 50% (Russia). This means that these assets 
            require continuous maintenance to extend their service life. Although 
            my personal experience is limited to a single manufacturing company, 
            it confirms that old machines make up a significant share of physical 
            assets and that engineers often struggle to find documentation and 
            accumulated knowledge about how to repair them developed over the years. 
        </p>
        <p>
            The concept is straightforward: every machine gets a QR code. An 
            engineer scans it and instantly receives access to: 
            <ul>
                <li>Technical documentation and service manuals</li>
                <li>List of breakdowns over the years</li>
                <li>Who repaired the machine, when it was repaired, and what was done.</li>
            </ul>

            Such information should significantly reduce repair time by 
            providing quicker access to documentation and insights into previous 
            failures, as many issues tend to recur.
        </p>
        <p>
            Tech stack: <br>
            Kotlin backend, React/TS web client, mobile web client, 
            Postgres, Docker Compose. 
        </p>
        <p>
            <a href="https://github.com/Gelassen/manufactory-knowledge-management-system">Github repository</a>
        </p>
        <p>
            <a href="https://gelassen.github.io/manufactory-knowledge-management-system/">Web site</a>
        </p>
    </section>
    <section>
        <h3>Market research</h3>
        <h4>Market capacity</h4>
        <p>
            Rosstat reported: 
            <ul>
                <li>The depreciation rate of fixed assets in the manufacturing industry is approximately 50%;</li>
                <li>Machinery and equipment are depreciated at approximately 50–52%;</li>
                <li>Approximately 18–20% of machinery and equipment are completely worn out.</li>
            </ul>
        </p>
        <p>
            The situation with machinery assets in the rest of the world doesn't 
            make a big difference:
        </p>
        <p>
            <img src="/assets/images/2026-06-20/market-capacity-part-I.png"/>
        </p> 
        <p>
            The next interesting metric is the number of manufacturing enterprises 
            with sufficiently complex and aging equipment where undocumented 
            knowledge causes downtime, onboarding issues, and dependence on key 
            personnel.
        </p>
        <p>
            The ballpark formula and estimate are as follows: <br>
            Target factories = Manufacturing enterprises × % with multi-machine 
            operations × % suffering from knowledge fragmentation
        </p>
        <p>
            <img src="/assets/images/2026-06-20/market-capacity-part-II.png"/>
        </p>
        <h4>Competitor analysis</h4>
        <p>
            <table>
                <tr>
                    <th>Product Category</th>
                    <th>Examples</th>
                    <th>Problems Solved</th>
                    <th>Weaknesses for This Use Case</th>
                </tr>

            <tr>
                <td>Generic Wiki / Documentation Systems</td>
                <td>Confluence, BookStack, MediaWiki</td>
                <td>
                    Documentation management, procedures, onboarding, knowledge sharing
                </td>
                <td>
                    Not machine-centric; no equipment inventory; no breakdown history;
                    QR workflows must be built manually.
                </td>
            </tr>

            <tr>
                <td>CMMS (Maintenance Systems)</td>
                <td>openMAINT, MaintainX, UpKeep</td>
                <td>
                    Work orders, preventive maintenance, asset tracking,
                    maintenance scheduling
                </td>
                <td>
                    Optimized for maintenance execution rather than preserving
                    institutional knowledge; documentation is usually secondary.
                </td>
            </tr>

            <tr>
                <td>MES (Manufacturing Execution Systems)</td>
                <td>OpenMES, IMES</td>
                <td>
                    Production tracking, work orders, routing, scheduling,
                    shop-floor execution, documentation attached to operations
                </td>
                <td>
                    Documentation is process-centric rather than machine-centric;
                    historical repair knowledge and troubleshooting experience are
                    usually not first-class entities.
                </td>
            </tr>

            <tr>
                <td>ERP + MES + QMS Platforms</td>
                <td>Carbon</td>
                <td>
                    Production planning, inventory management, quality control,
                    business processes, manufacturing operations
                </td>
                <td>
                    Broad enterprise scope increases implementation complexity and
                    deployment cost; preserving repair knowledge is only a small
                    subset of the platform.
                </td>
            </tr>

            <tr>
                <td>Enterprise EAM Platforms</td>
                <td>IBM Maximo, SAP Asset Management</td>
                <td>
                    Enterprise asset management, maintenance planning,
                    analytics, integrations
                </td>
                <td>
                    Expensive; complex deployment; excessive for many SMEs;
                    long implementation cycles.
                </td>
            </tr>

            <tr>
                <td>File Shares and Network Drives</td>
                <td>SharePoint, NAS, shared folders</td>
                <td>
                    Central storage of manuals and drawings
                </td>
                <td>
                    No machine context; poor searchability; no repair history;
                    knowledge remains fragmented.
                </td>
            </tr>

            <tr>
                <td>Paper Documentation</td>
                <td>Binders near machines</td>
                <td>
                    Immediate local availability
                </td>
                <td>
                    Easily outdated; difficult to search; impossible to aggregate
                    organizational knowledge.
                </td>
            </tr>

            <tr>
                <td>Human Memory ("Ask Sergey")</td>
                <td>Experienced maintenance personnel</td>
                <td>
                    Tacit knowledge and undocumented troubleshooting experience
                </td>
                <td>
                    Single point of failure; knowledge disappears with retirement
                    or employee turnover.
                </td>
            </tr>

            </table>

            <h5>Available open-source solutions</h5>

            <table>
                <tr>
                    <th>Product</th>
                    <th>Strengths</th>
                    <th>Missing for This Use Case</th>
                </tr>

            <tr>
                <td>BookStack</td>
                <td>
                    Excellent documentation UX, self-hosted, easy deployment
                </td>
                <td>
                    No machine model, no breakdown history, no maintenance context.
                </td>
            </tr>

            <tr>
                <td>MediaWiki</td>
                <td>
                    Extremely flexible, mature ecosystem
                </td>
                <td>
                    Requires heavy customization; poor UX for shop-floor engineers.
                </td>
            </tr>

            <tr>
                <td>openMAINT</td>
                <td>
                    Asset management and maintenance workflows
                </td>
                <td>
                    Heavy enterprise orientation; knowledge capture is secondary.
                </td>
            </tr>

            <tr>
                <td>Wiki.js</td>
                <td>
                    Modern documentation platform
                </td>
                <td>
                    Generic wiki only.
                </td>
            </tr>

            <tr>
                <td>OpenMES</td>
                <td>
                    Modern MES for small manufacturers; production tracking;
                    operational documentation
                </td>
                <td>
                    Optimized for production execution rather than preserving
                    machine repair knowledge and maintenance history.
                </td>
            </tr>

            </table>

            <h5>Available commercial solutions</h5>

            <table>
                <tr>
                    <th>Product</th>
                    <th>Strengths</th>
                    <th>Weaknesses</th>
                </tr>

            <tr>
                <td>MaintainX</td>
                <td>
                    Mobile-first CMMS, QR codes, work orders
                </td>
                <td>
                    Primarily maintenance execution rather than organizational
                    knowledge preservation.
                </td>
            </tr>

            <tr>
                <td>UpKeep</td>
                <td>
                    Strong mobile experience, preventive maintenance
                </td>
                <td>
                    Expensive for SMEs; knowledge retention is not its primary
                    value proposition.
                </td>
            </tr>

            <tr>
                <td>IBM Maximo</td>
                <td>
                    Industry-leading EAM capabilities
                </td>
                <td>
                    Very expensive and operationally heavy.
                </td>
            </tr>

            <tr>
                <td>SAP Asset Management</td>
                <td>
                    Deep integration into the SAP ecosystem
                </td>
                <td>
                    Significant implementation and consulting costs.
                </td>
            </tr>

            <tr>
                <td>Carbon</td>
                <td>
                    ERP + MES + QMS platform covering production,
                    inventory and quality processes
                </td>
                <td>
                    Broad business scope; machine knowledge preservation is not
                    the primary focus and may be excessive for SMEs seeking only
                    equipment documentation and repair history.
                </td>
            </tr>

            <tr>
                <td>IMES</td>
                <td>
                    Designed for job shops and discrete manufacturing;
                    production planning and shop-floor coordination
                </td>
                <td>
                    Strong production orientation but limited emphasis on capturing
                    tacit maintenance knowledge accumulated around individual
                    machines over many years.
                </td>
            </tr>

            </table>

            <h5>Capability comparison</h5>

            <table>
                <tr>
                    <th>Capability</th>
                    <th>Wiki</th>
                    <th>CMMS</th>
                    <th>MES</th>
                    <th>ERP/MES</th>
                    <th>Proposed KMS</th>
                </tr>

            <tr>
                <td>Documentation management</td>
                <td>✅</td>
                <td>⚠️</td>
                <td>⚠️</td>
                <td>⚠️</td>
                <td>✅</td>
            </tr>

            <tr>
                <td>Machine inventory</td>
                <td>❌</td>
                <td>✅</td>
                <td>⚠️</td>
                <td>⚠️</td>
                <td>✅</td>
            </tr>

            <tr>
                <td>QR access from shop floor</td>
                <td>❌</td>
                <td>✅</td>
                <td>⚠️</td>
                <td>⚠️</td>
                <td>✅</td>
            </tr>

            <tr>
                <td>Breakdown history</td>
                <td>❌</td>
                <td>✅</td>
                <td>⚠️</td>
                <td>⚠️</td>
                <td>✅</td>
            </tr>

            <tr>
                <td>Capture of repair know-how</td>
                <td>⚠️</td>
                <td>⚠️</td>
                <td>❌</td>
                <td>❌</td>
                <td>✅</td>
            </tr>

            <tr>
                <td>Fast deployment</td>
                <td>✅</td>
                <td>⚠️</td>
                <td>⚠️</td>
                <td>❌</td>
                <td>✅</td>
            </tr>

            <tr>
                <td>Affordable for SMEs</td>
                <td>✅</td>
                <td>⚠️</td>
                <td>⚠️</td>
                <td>❌</td>
                <td>✅</td>
            </tr>

            <tr>
                <td>Self-hosted open-source option</td>
                <td>✅</td>
                <td>⚠️</td>
                <td>⚠️</td>
                <td>❌</td>
                <td>✅</td>
            </tr>

            </table>
        </p>
        <p>
            Existing solutions tend to optimize one of three concerns:
            documentation management, maintenance execution, or production
            execution. Small and medium manufacturers frequently need something
            simpler: a machine-centric knowledge repository that can be deployed
            quickly, accessed directly from the shop floor via QR codes, and
            preserve historical maintenance knowledge that would otherwise remain
            locked inside individual engineers' heads.
        </p>
        <h4>Potential market fit</h4>

        <p>
            The strongest signal of market fit is not the absence of competitors, but rather the fragmentation of partial solutions.
            Existing systems typically solve adjacent problems: documentation (wikis), maintenance execution (CMMS), production tracking (MES),
            or enterprise asset management (EAM). However, none of them treats the machine itself as the central knowledge entity
            that accumulates operational history over time.
        </p>

        <p>
            In practice, most manufacturing companies operate in a hybrid state:
        </p>

        <ul>
            <li>formal maintenance systems exist but are underused or partially implemented;</li>
            <li>documentation is stored in shared folders or paper binders;</li>
            <li>critical knowledge remains in the heads of a small number of technicians;</li>
            <li>production and maintenance systems are disconnected.</li>
        </ul>

        <p>
            This creates a consistent operational gap: information exists, but it is not accessible in the context where it is needed
            (at the machine, during failure, under time pressure).
        </p>

        <p>
            The proposed system is positioned to fill this gap by unifying three layers:
        </p>

        <ul>
            <li><b>static knowledge</b> (manuals, procedures, documentation),</li>
            <li><b>historical operational knowledge</b> (breakdowns, repairs, patterns),</li>
            <li><b>contextual access layer</b> (QR-based retrieval directly at the machine).</li>
        </ul>

        <p>
            This combination is particularly relevant in environments with:
        </p>

        <ul>
            <li>heterogeneous equipment fleets (different generations and vendors),</li>
            <li>limited digital integration between systems,</li>
            <li>high dependency on experienced technicians,</li>
            <li>cost-sensitive production where downtime is still expensive but not digitized away.</li>
        </ul>

        <p>
            From a geographic perspective, these conditions are not confined to a single region.
            They are common across Eastern Europe, parts of Western Europe (notably SME manufacturing sectors),
            the United States industrial mid-market, and rapidly industrializing economies in Asia.
        </p>

        <p>
            The most promising segment is not the most advanced factories, but rather the “in-between” segment:
            companies that are large enough to suffer from knowledge fragmentation, but too small or too fragmented
            to justify heavy enterprise systems such as SAP or IBM Maximo.
        </p>

        <p>
            In this sense, the product does not compete directly with MES or ERP systems. Instead, it operates as a
            lightweight layer above them — or alongside them — focused exclusively on preserving and operationalizing
            machine-level knowledge.
        </p>

        <p>
            A practical indicator of product-market fit would be the moment when maintenance teams stop asking:
        </p>

        <blockquote>
            “Where is the manual for this machine?”
        </blockquote>

        <p>
            and instead begin asking:
        </p>

        <blockquote>
            “What has historically been done when this machine failed in this way?”
        </blockquote>

        <p>
            That shift represents a transition from documentation-centric behavior to knowledge-centric behavior,
            which is the core value proposition of the system.
        </p>

        <p>
            Finally, the adoption curve is likely to follow a bottom-up pattern. Initial usage is driven by a single workshop,
            production line, or maintenance team. Once the value of reduced downtime and faster troubleshooting becomes visible,
            the system can expand horizontally across the factory and vertically across multiple sites.
        </p>

        <h4>How much to charge for this product to stay attractive for the customer?</h4>
        <p>
            Knowledge management systems are somewhat unusual products because they are
            difficult to evaluate in isolation. Customers do not buy documentation,
            QR codes, or a searchable wiki. They buy fewer hours of stopped production,
            less dependence on individual experts, and faster recovery when something
            eventually breaks.
        </p>
        <p>
            Therefore, pricing should not be benchmarked against generic wiki software
            such as Confluence or SharePoint. It should be benchmarked against the
            financial impact of equipment downtime.
        </p>
        <p>
            A simple ROI model can be expressed as:
        </p>
        <pre>
            Annual benefit =
                downtime reduction
            + reduced time spent searching for information
            + faster onboarding of engineers
            + avoided losses from knowledge leaving the company
        </pre>
        <p>
            Consider a small factory:
        </p>
        <ul>
            <li>100 machines;</li>
            <li>6 maintenance technicians;</li>
            <li>15 significant breakdowns per year;</li>
            <li>2 hours saved per incident;</li>
            <li>Downtime cost: €2,000 per hour.</li>
        </ul>
        <p>
            Downtime savings alone are:
        </p>
        <pre>
            15 × 2 × €2,000 = €60,000 per year
        </pre>
        <p>
            If the system also saves engineers twenty minutes per day previously spent
            searching for manuals, drawings, and historical repair information, the
            labour savings can easily exceed another €10,000–15,000 annually.
        </p>
        <p>
            Even conservative assumptions quickly produce annual benefits in the range
            of €50,000–100,000 for a medium-sized factory.
        </p>
        <p>
            As a rule of thumb, industrial software remains an easy purchasing decision
            when its annual cost is below 10% of the measurable value it creates.
        </p>
        <p>
            This leads to an interesting conclusion. Although the product itself is
            technically simple, its value proposition is not. A system that saves a
            factory €50,000 per year should not be sold for €200 simply because it is
            "only a documentation system".
        </p>
        <p>
            A more reasonable pricing strategy might look as follows:
        </p>
        <table>
            <tr>
                <th>Customer profile</th>
                <th>Typical savings</th>
                <th>Suggested annual price</th>
            </tr>
            <tr>
                <td>Small workshop (10–30 machines)</td>
                <td>€5k–20k</td>
                <td>€500–2k</td>
            </tr>
            <tr>
                <td>Medium factory (30–200 machines)</td>
                <td>€20k–100k</td>
                <td>€2k–10k</td>
            </tr>
            <tr>
                <td>Large plant (200+ machines)</td>
                <td>€100k+</td>
                <td>€10k–30k+</td>
            </tr>
        </table>
        <p>
            Regional purchasing power should also be taken into account.
        </p>
        <table>
            <tr>
                <th>Market</th>
                <th>Indicative annual price range</th>
            </tr>
            <tr>
                <td>Russia and Eastern Europe</td>
                <td>€500–5,000</td>
            </tr>
            <tr>
                <td>Western Europe</td>
                <td>€2,000–15,000</td>
            </tr>
            <tr>
                <td>United States</td>
                <td>€3,000–20,000</td>
            </tr>
        </table>
        <p>
            The pricing model should probably scale with the customer's complexity:
            number of machines, number of users, or number of production sites. Such
            metrics are easy to understand and correlate reasonably well with the value
            generated by the system.
        </p>
        <p>
            The product is better described as a form of insurance
            against knowledge loss and expensive production downtime. If a factory
            believes the system can prevent even a single serious incident per year,
            paying several thousand euros annually becomes a rational business decision.
        </p>
    </section>
    <section>
        <h3>Architecture</h3>
        <p>
            <img src="/assets/images/2026-06-20/architecture-diagram.jpg"/>
        </p> 
        <h4>High-Level Flow:</h4>
        <p>
            User (operator/technician on shop floor) → opens Web Client (React/TS) on mobile/desktop. <br><br>
            Presses Scan → uses device camera (rear preferred) to read QR/Barcode on equipment. <br><br>
            Frontend calls Backend → GET /api/v1/machine/barcode/{barcode}. <br><br>
            Backend returns machine data or redirects to /machines/{id}. <br><br>
            Machine Card shows: documentation, maintenance history, solutions to past issues, attachments (PDFs, videos, schemas).
        </p>
        <h4>Deployment View (Docker Compose)</h4>
        <p>
            <ul>
                <li>
                    Services:
                    <ul>
                        <li>web / web-prod → React frontend (port 3000)</li>
                        <li>server → Kotlin Spring Boot backend (port 8080 + Swagger)</li>
                        <li>database → PostgreSQL</li>   
                    </ul>
                </li>
                <li>Profiles: prod and dev</li>
                <li>All self-hosted, easy one-command deploy.</li>
            </ul>
        </p>
        <h4>Strengths</h4>
        <p>
            <ul>
                <li>Mobile-first with strong Android/Chrome focus.</li>
                <li>Simple, maintainable stack.</li>
                <li>QR-driven navigation = core differentiator for shop-floor use.</li>
            </ul>
        </p>
    </section>
    <section>
        <h3>Market entry strategy</h3>

        <p>
            This section describes a rough vision of how the product is expected to enter the market
            and evolve from early validation to scalable sales. 
        </p>

        <h4>Phase 1 — Validation</h4>
        <ul>
            <li>Landing page with clear product positioning and use cases</li>
            <li>Public GitHub repository (transparency + trust for technical buyers)</li>
            <li>1–3 pilot factories for real-world testing</li>
            <li>Manual outreach to maintenance engineers and plant managers</li>
            <li>No or minimal paid advertising</li>
        </ul>

        <p>
            Goal: validate that the system is actually used in real workflows and that a full usage loop exists
            (scan → find knowledge → solve problem → repeat usage).
        </p>

        <h4>Phase 2 — Proof of value</h4>
        <ul>
            <li>Derive at least one concrete case study from a pilot factory</li>
            <li>Refine positioning based on real feedback from technicians and managers</li>
            <li>Improve onboarding and first-time setup experience</li>
            <li>Introduce first paying customers, even at small scale</li>
        </ul>

        <p>
            Goal: confirm willingness to pay and validate that the product is perceived as economically valuable,
            not just “useful software”.
        </p>

        <h4>Phase 3 — Early scaling</h4>
        <ul>
            <li>Targeted advertising to specific industrial niches (not broad marketing)</li>
            <li>Outbound outreach via LinkedIn and industry networks</li>
            <li>Initial reseller or sales partners, but only after messaging is stable and proven</li>
        </ul>

        <p>
            Goal: establish a repeatable acquisition channel that can consistently generate new customers
            without relying on founder-led sales alone.
        </p>

        <h4>Phase 4 — Sales expansion</h4>
        <ul>
            <li>Hire regional sales representatives</li>
            <li>Expand into EU and US industrial markets</li>
            <li>Build localized sales and onboarding processes</li>
        </ul>

        <p>
            Goal: transition from founder-driven distribution to a structured sales organization capable of scaling
            across regions and industries.
        </p>
    </section>

    <section>
        <h3>Pricing model</h3>
        <p>
            Right now open source version (free) and custom extension by customer 
            demand (paid) are available right now. SaaS option and technical support are 
            possible as one of the offerings in future.   
        </p>
        <p>
            The product follows a hybrid distribution model combining open-source self-hosting with a potential paid SaaS offering
            and optional enterprise services. This structure is designed to maximize adoption in early stages while
            enabling sustainable monetization in environments where reliability, integration, and operational support are critical.
        </p>

        <h4>1. Open-source (self-hosted) model</h4>

        <ul>
            <li>Free and open-source core product</li>
            <li>Full access to source code and deployment configuration</li>
            <li>Self-hosted deployment on customer infrastructure (on-premise or private cloud)</li>
            <li>No licensing fees or vendor lock-in</li>
            <li>Community-driven or internal support responsibility</li>
        </ul>

        <p>
            This model is intended to enable fast adoption and low-friction evaluation in real production environments.
            It is particularly suitable for companies with internal IT capacity and a preference for infrastructure control.
        </p>

        <p>
            The open-source version includes the core functionality:
            machine registry, QR-based access to documentation, and basic maintenance history tracking.
        </p>

        <h4>2. SaaS (managed platform) model</h4>

        <ul>
            <li>Fully hosted and managed deployment</li>
            <li>Automated updates, monitoring, and backups</li>
            <li>Operational support and maintenance included</li>
            <li>Secure access management and system administration</li>
        </ul>

        <p>
            The SaaS version is not only a hosting alternative, but an operational layer designed for production environments
            where uptime, simplicity, and reduced internal IT burden are critical.
        </p>

        <p>
            In addition to the core features, the SaaS platform may include capabilities that are difficult to replicate
            in self-hosted deployments, such as:
        </p>

        <ul>
            <li>Multi-site synchronization across factories</li>
            <li>Centralized administration of distributed equipment fleets</li>
            <li>Audit logs and operational traceability</li>
            <li>Advanced backup and disaster recovery mechanisms</li>
        </ul>

        <p>
            Pricing is based on operational scale (number of machines, users, or sites) and level of service.
        </p>

        <h4>3. Enterprise support and integration services</h4>

        <ul>
            <li>Onboarding and guided deployment in production environments</li>
            <li>Integration with existing MES, ERP, or CMMS systems</li>
            <li>Data migration from legacy documentation systems</li>
            <li>Technical support tailored to operational requirements</li>
        </ul>

        <p>
            This layer addresses the reality of industrial environments where adoption often depends not only on software,
            but on successful integration into existing processes and infrastructure.
        </p>

        <h4>4. Customisation and extension model</h4>

        <p>
            The platform is designed to be extensible to accommodate specific workflows, machine types, and organizational needs.
            Customisation typically includes:
        </p>

        <ul>
            <li>Custom feature development on top of the core system</li>
            <li>Specialized UI/UX adaptations for shop-floor usage</li>
            <li>Integration with proprietary systems or internal tools</li>
            <li>Private extensions maintained for individual customers</li>
        </ul>

        <p>
            Customisation is handled on a project basis and is priced individually depending on scope, complexity,
            and long-term maintenance requirements.
        </p>

        <h4>5. Product evolution perspective</h4>

        <p>
            The pricing structure reflects an expected evolution of the product over time.
        </p>

        <p>
            In early stages, value is primarily delivered through ease of adoption and transparency via the open-source core.
            As deployments mature, value shifts toward operational reliability, integration depth, and cross-site coordination.
        </p>

        <p>
            In later stages, the product is expected to evolve from a documentation and access layer into a
            machine-centric operational knowledge system, where higher-value capabilities such as
            pattern recognition, recurring failure analysis, and decision support become increasingly important.
        </p>

        <p>
            This progression allows the product to remain accessible for small deployments while gradually increasing
            monetization potential as organizational dependency on the system grows.
        </p>

        <h4>Summary</h4>

        <ul>
            <li>Open-source core ensures fast adoption and trust-building</li>
            <li>SaaS monetizes operational convenience and reliability</li>
            <li>Enterprise services cover integration and deployment complexity</li>
            <li>Customisation enables adaptation to real-world industrial variability</li>
        </ul>

        <p>
            The model is intentionally designed to start as an accessible tool and evolve into a critical operational layer
            in manufacturing environments where knowledge retention and downtime reduction have direct financial impact.
        </p>
    </section>
</article>]]></content><author><name>Gelassen</name></author><summary type="html"><![CDATA[Executive summary This week I finished work on a minimum viable product (MVP) for a manufacturing company that aims to reduce machine downtime and therefore cut losses. It addresses the following pain point: "We have a machine. Where is all the information about it, and how can we ensure that this knowledge doesn't disappear when employees leave?". According to available statistics, the depreciation rate of fixed assets in the manufacturing industry is about 50% (Russia). This means that these assets require continuous maintenance to extend their service life. Although my personal experience is limited to a single manufacturing company, it confirms that old machines make up a significant share of physical assets and that engineers often struggle to find documentation and accumulated knowledge about how to repair them developed over the years. The concept is straightforward: every machine gets a QR code. An engineer scans it and instantly receives access to: Technical documentation and service manuals List of breakdowns over the years Who repaired the machine, when it was repaired, and what was done.]]></summary></entry><entry><title type="html">Artificial Intelligence in Education and Management: Strategic Framework, Risks, and Practical Implications</title><link href="https://gelassen.github.io/2026/06/19/artificial-intelligence-in-education-and-management.html" rel="alternate" type="text/html" title="Artificial Intelligence in Education and Management: Strategic Framework, Risks, and Practical Implications" /><published>2026-06-19T00:00:00+00:00</published><updated>2026-06-19T00:00:00+00:00</updated><id>https://gelassen.github.io/2026/06/19/artificial-intelligence-in-education-and-management</id><content type="html" xml:base="https://gelassen.github.io/2026/06/19/artificial-intelligence-in-education-and-management.html"><![CDATA[<!DOCTYPE html>
<html lang="en">
<head>
    <meta charset="UTF-8">
    <meta name="viewport" content="width=device-width, initial-scale=1.0">
    <link rel="stylesheet" href=".css/general.css">
</head>
<body>
<article>

    <section>
        <h3>Executive Summary</h3>

        <p>
            This week I prepared a document to establish a strategic framework for
            the use of Artificial Intelligence (AI) in educational and managerial
            processes and to identify the key systemic risks associated with its adoption.
        </p>

        <p>
            Initially prepared to facilitate AI adoption within Financial 
            University (Russia), you are welcome to use it as a foundation to 
            facilitate discussions in your own workspace.
        </p>

        <p>
            This is not merely about improving individual processes through technology.
            AI has the potential to fundamentally transform education, work,
            and knowledge management.
        </p>

    </section>

    <section>
        <h3>The Core Thesis</h3>

        <p>
            Artificial Intelligence has already ceased to be merely an auxiliary tool.
        </p>

        <p>
            It is becoming:
        </p>

        <ul>
            <li>a factor of productivity;</li>
            <li>a factor of competitiveness;</li>
            <li>a factor of organizational and governmental management;</li>
            <li>a factor influencing the structure of the labor market.</li>
        </ul>

        <p>
            In practice, AI is increasingly acting as a universal amplifier
            of intellectual activity, comparable in significance to previous
            technological revolutions.
        </p>
    </section>

    <section>
        <h3>Practical Observation: The Effect Is Already Visible</h3>

        <p>
            Even without making long-term predictions, several changes can already
            be observed:
        </p>

        <ul>
            <li>significant acceleration of knowledge work;</li>
            <li>lower costs of performing intellectual tasks;</li>
            <li>the ability of one person to perform work that previously required a team;</li>
            <li>faster learning and acquisition of new competencies.</li>
        </ul>

        <p>
            The difference between people who use AI and those who do not is already
            becoming a significant productivity gap.
        </p>

        <p>
            Similarly, access to stronger and weaker AI models creates
            persistent competitive inequalities.
        </p>
    </section>

    <section>
        <h3>Strategic Implications</h3>

        <p>
            Artificial Intelligence is gradually becoming a strategic resource that
            influences:
        </p>

        <ul>
            <li>economic resilience;</li>
            <li>technological development;</li>
            <li>educational outcomes;</li>
            <li>the pace of scientific progress;</li>
            <li>the competitiveness of organizations and states.</li>
        </ul>

        <p>
            At the same time, access to AI should not be confused with technological
            independence from it.
        </p>
    </section>

    <section>
        <h3>Technological Sovereignty and Dependency</h3>

        <p>
            In the context of AI, technological sovereignty cannot be reduced to
            the formal use of a domestic product.
        </p>

        <p>
            The real question is different:
        </p>

        <p>
            <b>
                Does the solution provide genuine technological autonomy,
                or does it merely localize the interface on top of a global
                technological dependency?
            </b>
        </p>

        <p>
            In practice, most modern solutions:
        </p>

        <ul>
            <li>use external models;</li>
            <li>depend on the global open-source ecosystem;</li>
            <li>or combine both approaches.</li>
        </ul>

        <p>
            Full independence in advanced AI remains extremely limited because it
            requires simultaneous control over:
        </p>

        <ul>
            <li>computing infrastructure;</li>
            <li>models;</li>
            <li>data;</li>
            <li>research talent.</li>
        </ul>

        <p>
            Even the world's leading players rarely possess complete autonomy
            across all of these layers.
        </p>
    </section>

    <section>
        <h3>The Systemic Risk of Dependency</h3>

        <p>
            The use of external AI services creates a new form of technological
            dependency:
        </p>

        <ul>
            <li>dependency on model providers;</li>
            <li>dependency on infrastructure providers;</li>
            <li>dependency on access rules and restrictions;</li>
            <li>dependency on data processing policies.</li>
        </ul>

        <p>
            This is not an abstract concern. It is a structural property of the
            current AI ecosystem.
        </p>

        <p>
            Building a fully autonomous national AI stack requires resources of such
            magnitude that it becomes an exceptionally difficult and long-term task.
        </p>
    </section>

    <section>
        <h3>AI as a Factor in the Redistribution of Power and Knowledge</h3>

        <p>
            AI affects not only productivity but also:
        </p>

        <ul>
            <li>the distribution of knowledge;</li>
            <li>access to expert interpretation of information;</li>
            <li>decision formation;</li>
            <li>the speed of decision-making.</li>
        </ul>

        <p>
            Control over AI infrastructure is therefore becoming a source of influence
            comparable to control over energy or industrial resources in previous eras.
        </p>
    </section>

    <section>
        <h3>Risks of Using AI in Education</h3>

        <p>
            In education, AI creates not only opportunities but also systemic risks.
        </p>

        <h4>Risk #1. Cognitive Degradation Through Improper Use</h4>

        <p>
            Excessive reliance on AI may result in:
        </p>

        <ul>
            <li>reduced ability to solve problems independently;</li>
            <li>weakened analytical and synthesis skills;</li>
            <li>loss of the ability to formulate conclusions;</li>
            <li>delegation of thinking responsibility to an external system.</li>
        </ul>

        <p>
            In such a scenario, education risks partially losing its fundamental
            mission: the development of independent thinking.
        </p>

        <h4>Risk #2. Errors and the Illusion of Authority</h4>

        <p>
            Modern AI models:
        </p>

        <ul>
            <li>can confidently generate incorrect answers;</li>
            <li>do not possess an intrinsic mechanism of truth;</li>
            <li>may create an illusion of expertise.</li>
        </ul>

        <p>
            This becomes particularly dangerous when users cannot independently
            verify the results.
        </p>

        <h4>Risk #3. Informational and Behavioral Constraints</h4>

        <p>
            AI models are not neutral systems.
        </p>

        <ul>
            <li>they contain embedded constraints;</li>
            <li>they shape acceptable forms of response;</li>
            <li>they may influence the user's reasoning process.</li>
        </ul>

        <p>
            This creates a risk of information bias without explicit awareness of
            the process itself.
        </p>

        <h4>Risk #4. Loss of Control Over Intellectual Data</h4>

        <p>
            The use of cloud AI services raises several questions:
        </p>

        <ul>
            <li>where and how data is used;</li>
            <li>whether it can be utilized for model training;</li>
            <li>who controls future use of the results.</li>
        </ul>

        <p>
            This creates the potential loss of full control over the outcomes
            of intellectual work.
        </p>
    </section>

    <section>
        <h3>Approaches to Risk Mitigation</h3>

        <p>
            Risks do not imply that AI should be rejected.
        </p>

        <p>
            They imply the need for controlled adoption.
        </p>

        <h4>Principle #1. Augmentation Rather Than Replacement</h4>

        <p>
            AI should be used as:
        </p>

        <ul>
            <li>a tool for amplifying thinking;</li>
            <li>a tool for feedback and validation;</li>
            <li>a learning instrument.</li>
        </ul>

        <p>
            It should not become:
        </p>

        <ul>
            <li>a replacement for thinking;</li>
            <li>a replacement for learning;</li>
            <li>a replacement for responsibility in decision-making.</li>
        </ul>

        <h4>Principle #2. Separation of Usage Levels</h4>

        <p>
            Different categories of information should be treated differently:
        </p>

        <ul>
            <li>critical data — local processing;</li>
            <li>working data — controlled cloud services;</li>
            <li>educational data — acceptable use of external models.</li>
        </ul>

        <h4>Principle #3. Multi-Model Strategy</h4>

        <p>
            Dependency can be reduced through:
        </p>

        <ul>
            <li>using multiple models;</li>
            <li>comparing outputs;</li>
            <li>avoiding critical dependence on a single provider.</li>
        </ul>

        <h4>Principle #4. The Role of the Teacher Is Strengthened</h4>

        <p>
            With proper adoption:
        </p>

        <ul>
            <li>teachers are not replaced;</li>
            <li>they become stronger as mentors and experts.</li>
        </ul>

        <p>
            Their role increasingly shifts toward:
        </p>

        <ul>
            <li>problem formulation;</li>
            <li>interpretation of results;</li>
            <li>development of thinking;</li>
            <li>quality control of reasoning.</li>
        </ul>
    </section>

    <section>
        <h3>Conclusion</h3>

        <p>
            Artificial Intelligence is simultaneously a technology that:
        </p>

        <ul>
            <li>dramatically increases productivity;</li>
            <li>changes the structure of knowledge and work;</li>
            <li>creates new forms of dependency;</li>
            <li>requires reconsideration of educational and management approaches.</li>
        </ul>

        <p>
            The key conclusion is straightforward:
        </p>

        <p>
            <b>
                The adoption of AI should be viewed not as a local digitalization
                initiative but as a strategic transformation of education and
                intellectual work.
            </b>
        </p>

        <p>
            At the same time, it is critically important to preserve a balance between:
        </p>

        <ul>
            <li>leveraging the opportunities created by AI;</li>
            <li>preserving the human capacity to think, learn, and make decisions independently.</li>
        </ul>
    </section>

    <section>
        <h3>Related Publications</h3>

        <ul>
            <li>
                <a href="https://gelassen.github.io/2025/12/20/cognitive-risks-of-using-ai-and-how-to-mitigate-them.html">Cognitive risks of using AI and how to mitigate them (December, 2025)</a>
            </li>
            <li>
                <a href="https://gelassen.github.io/2024/06/23/the-modern-education-and-place-of-ai-here.html">The modern education and place of AI here (July, 2024)</a>
            </li>
        </ul>
    </section>
</article>
</body>
</html>]]></content><author><name>Gelassen</name></author><summary type="html"><![CDATA[]]></summary></entry></feed>